Iterations overview
This view is being rolled out gradually. If you don't see it yet, it hasn't been enabled for your workspace.
The Iteration Board shows the running iteration. The Iterations view (key 3, then 2) shows all of them: it is the look back at how goal, scope and velocity developed from iteration to iteration. You need it before a planning (How much did we deliver last time?) and before a review.
The table
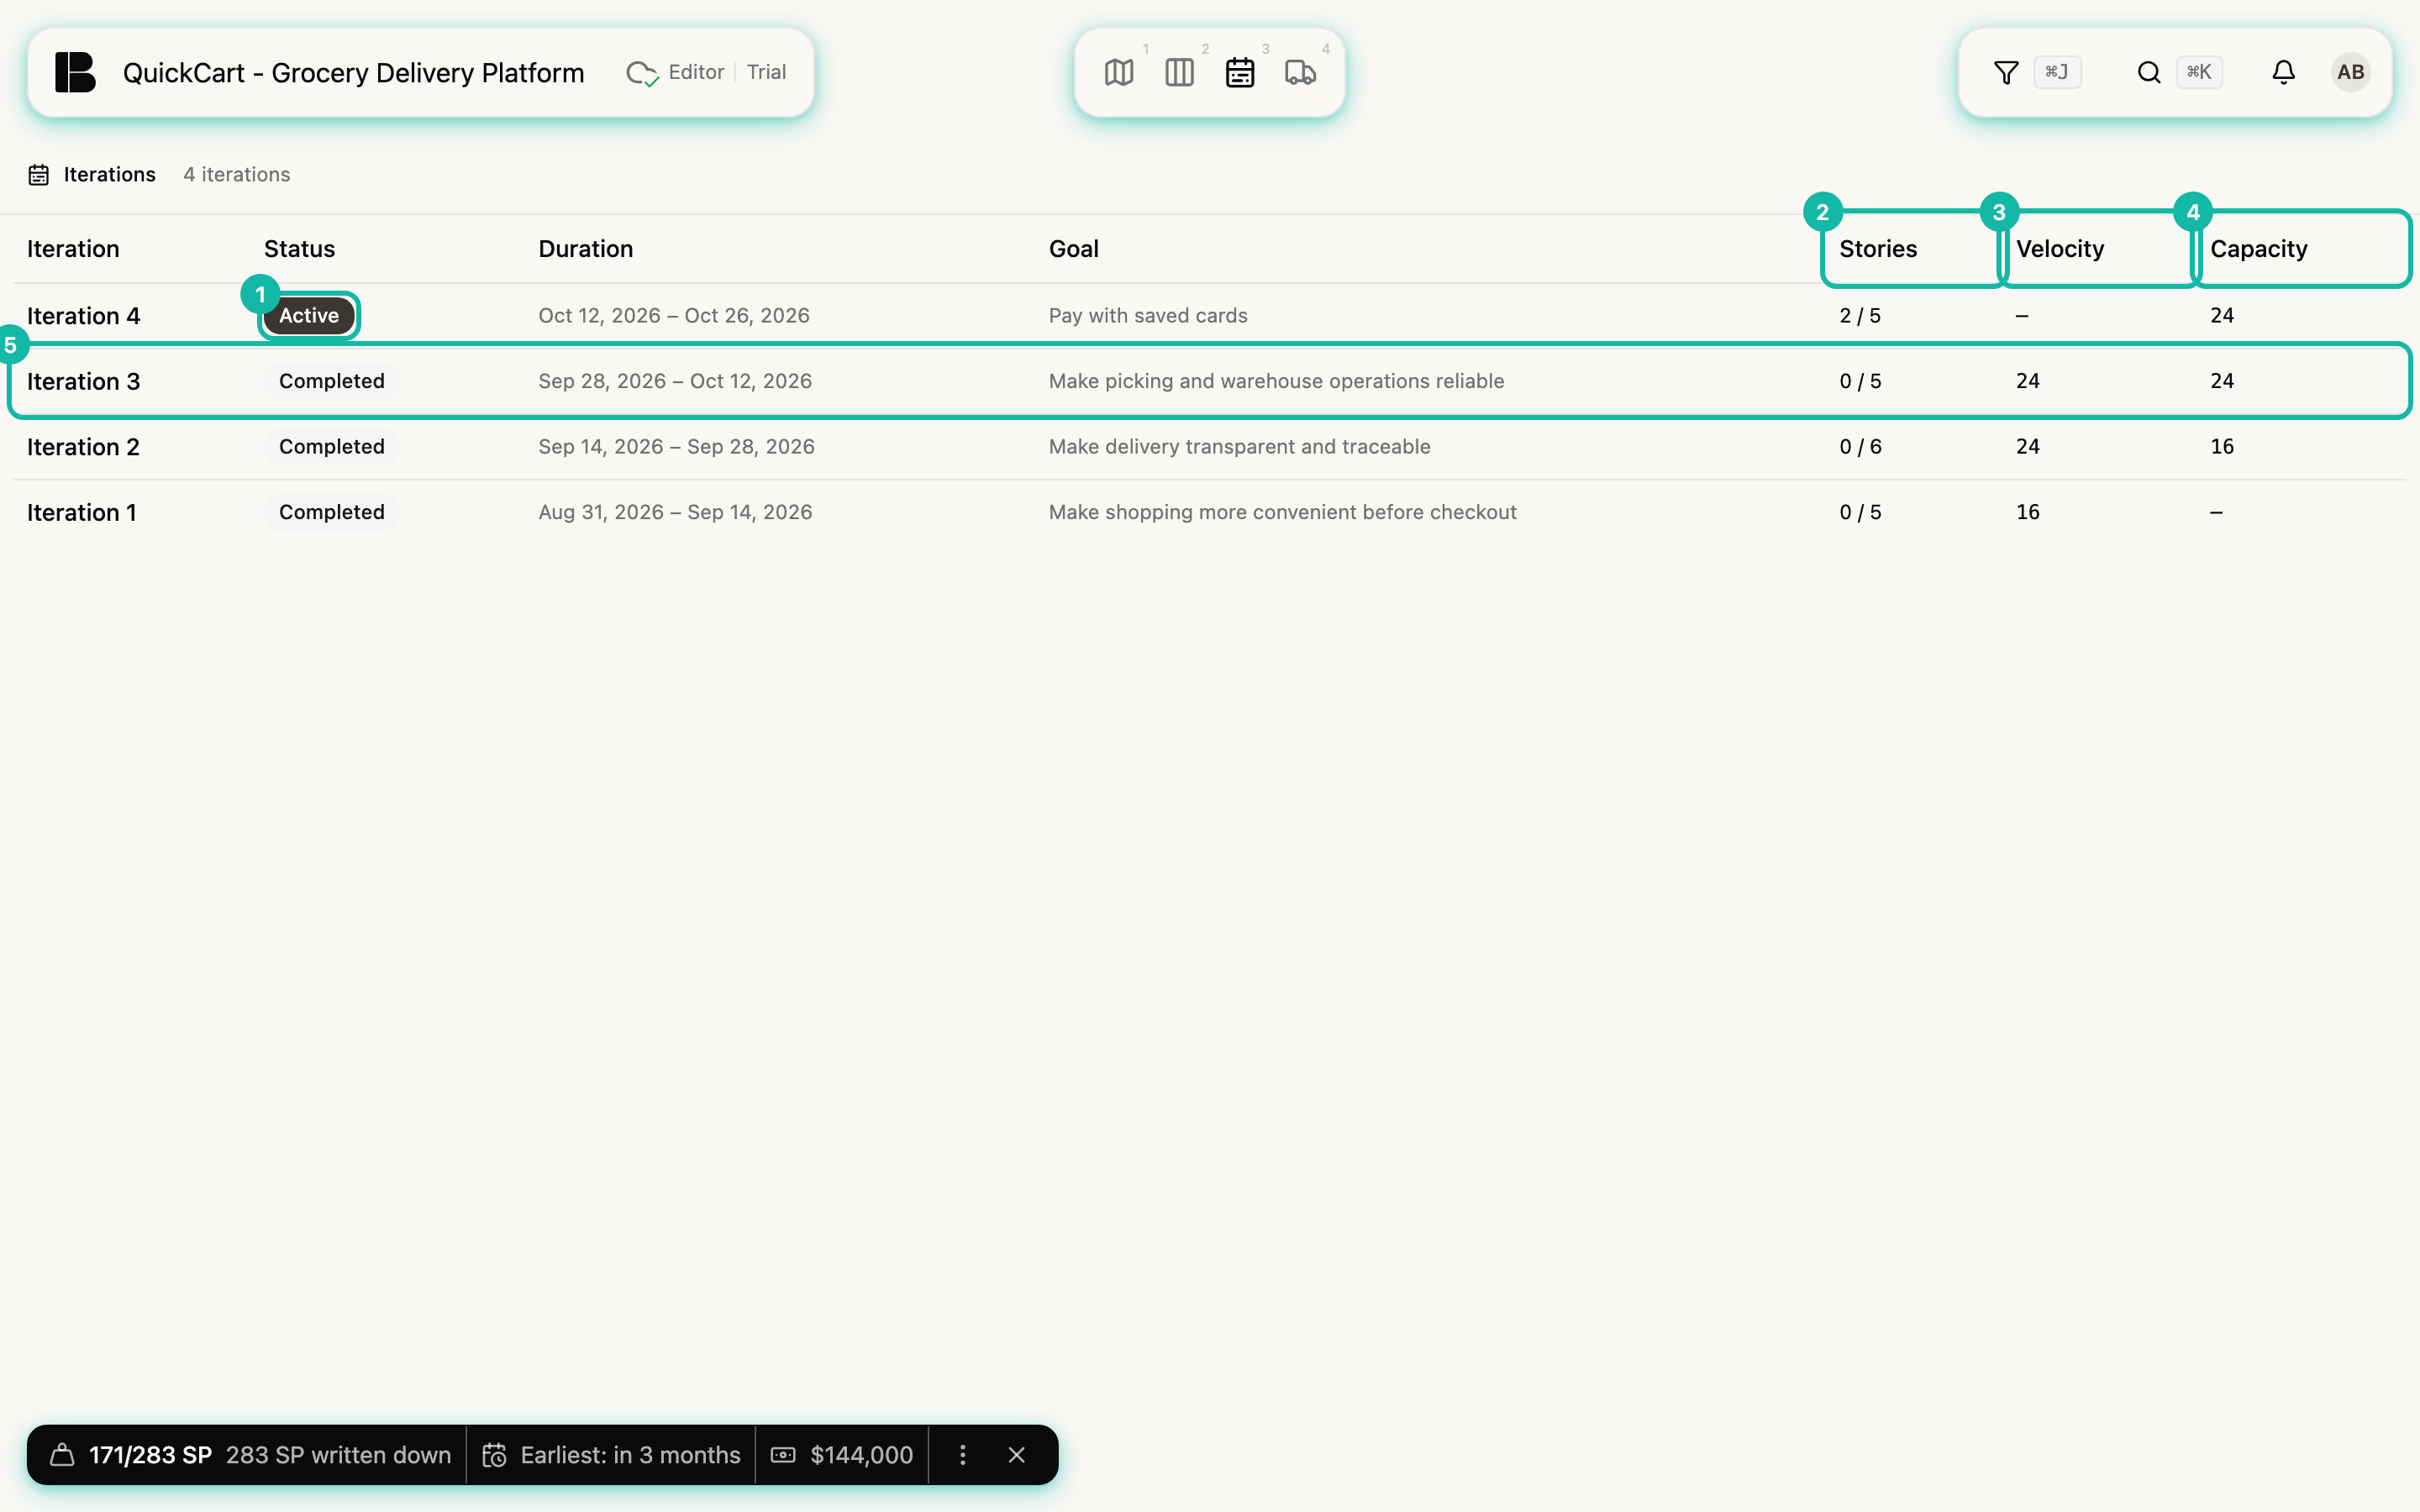
The newest iteration is at the top. Each row has these columns:
| Column | Meaning |
|---|---|
| Iteration | Title |
| Status | Active, Overdue (end passed, not completed) or Completed |
| Duration | Start and end |
| Goal | The iteration goal |
| Stories | Split discovery / delivery, for example 2 / 5 |
| Velocity | The story points delivered, from the snapshot. — for the running iteration, which has none yet |
| Capacity | The expected velocity: the entered value for the running iteration, the value recorded at completion for completed ones |
A missing value shows as —, so a gap never looks like a zero.
Read velocity over time
Compare Capacity and Velocity from top to bottom. In QuickCart, Iteration 2 planned 16 points and delivered 24, Iteration 3 planned 24 and delivered 24. If velocity is always below capacity, your team plans too much. If it is above, it plans cautiously. Betterplan uses the average of the three most recently completed iterations as the project velocity for forecasts (see Estimating). The Insights phase offers a chart.
An iteration in detail
A click on a row opens the details in a side panel. The address contains the iteration, so you can share it.
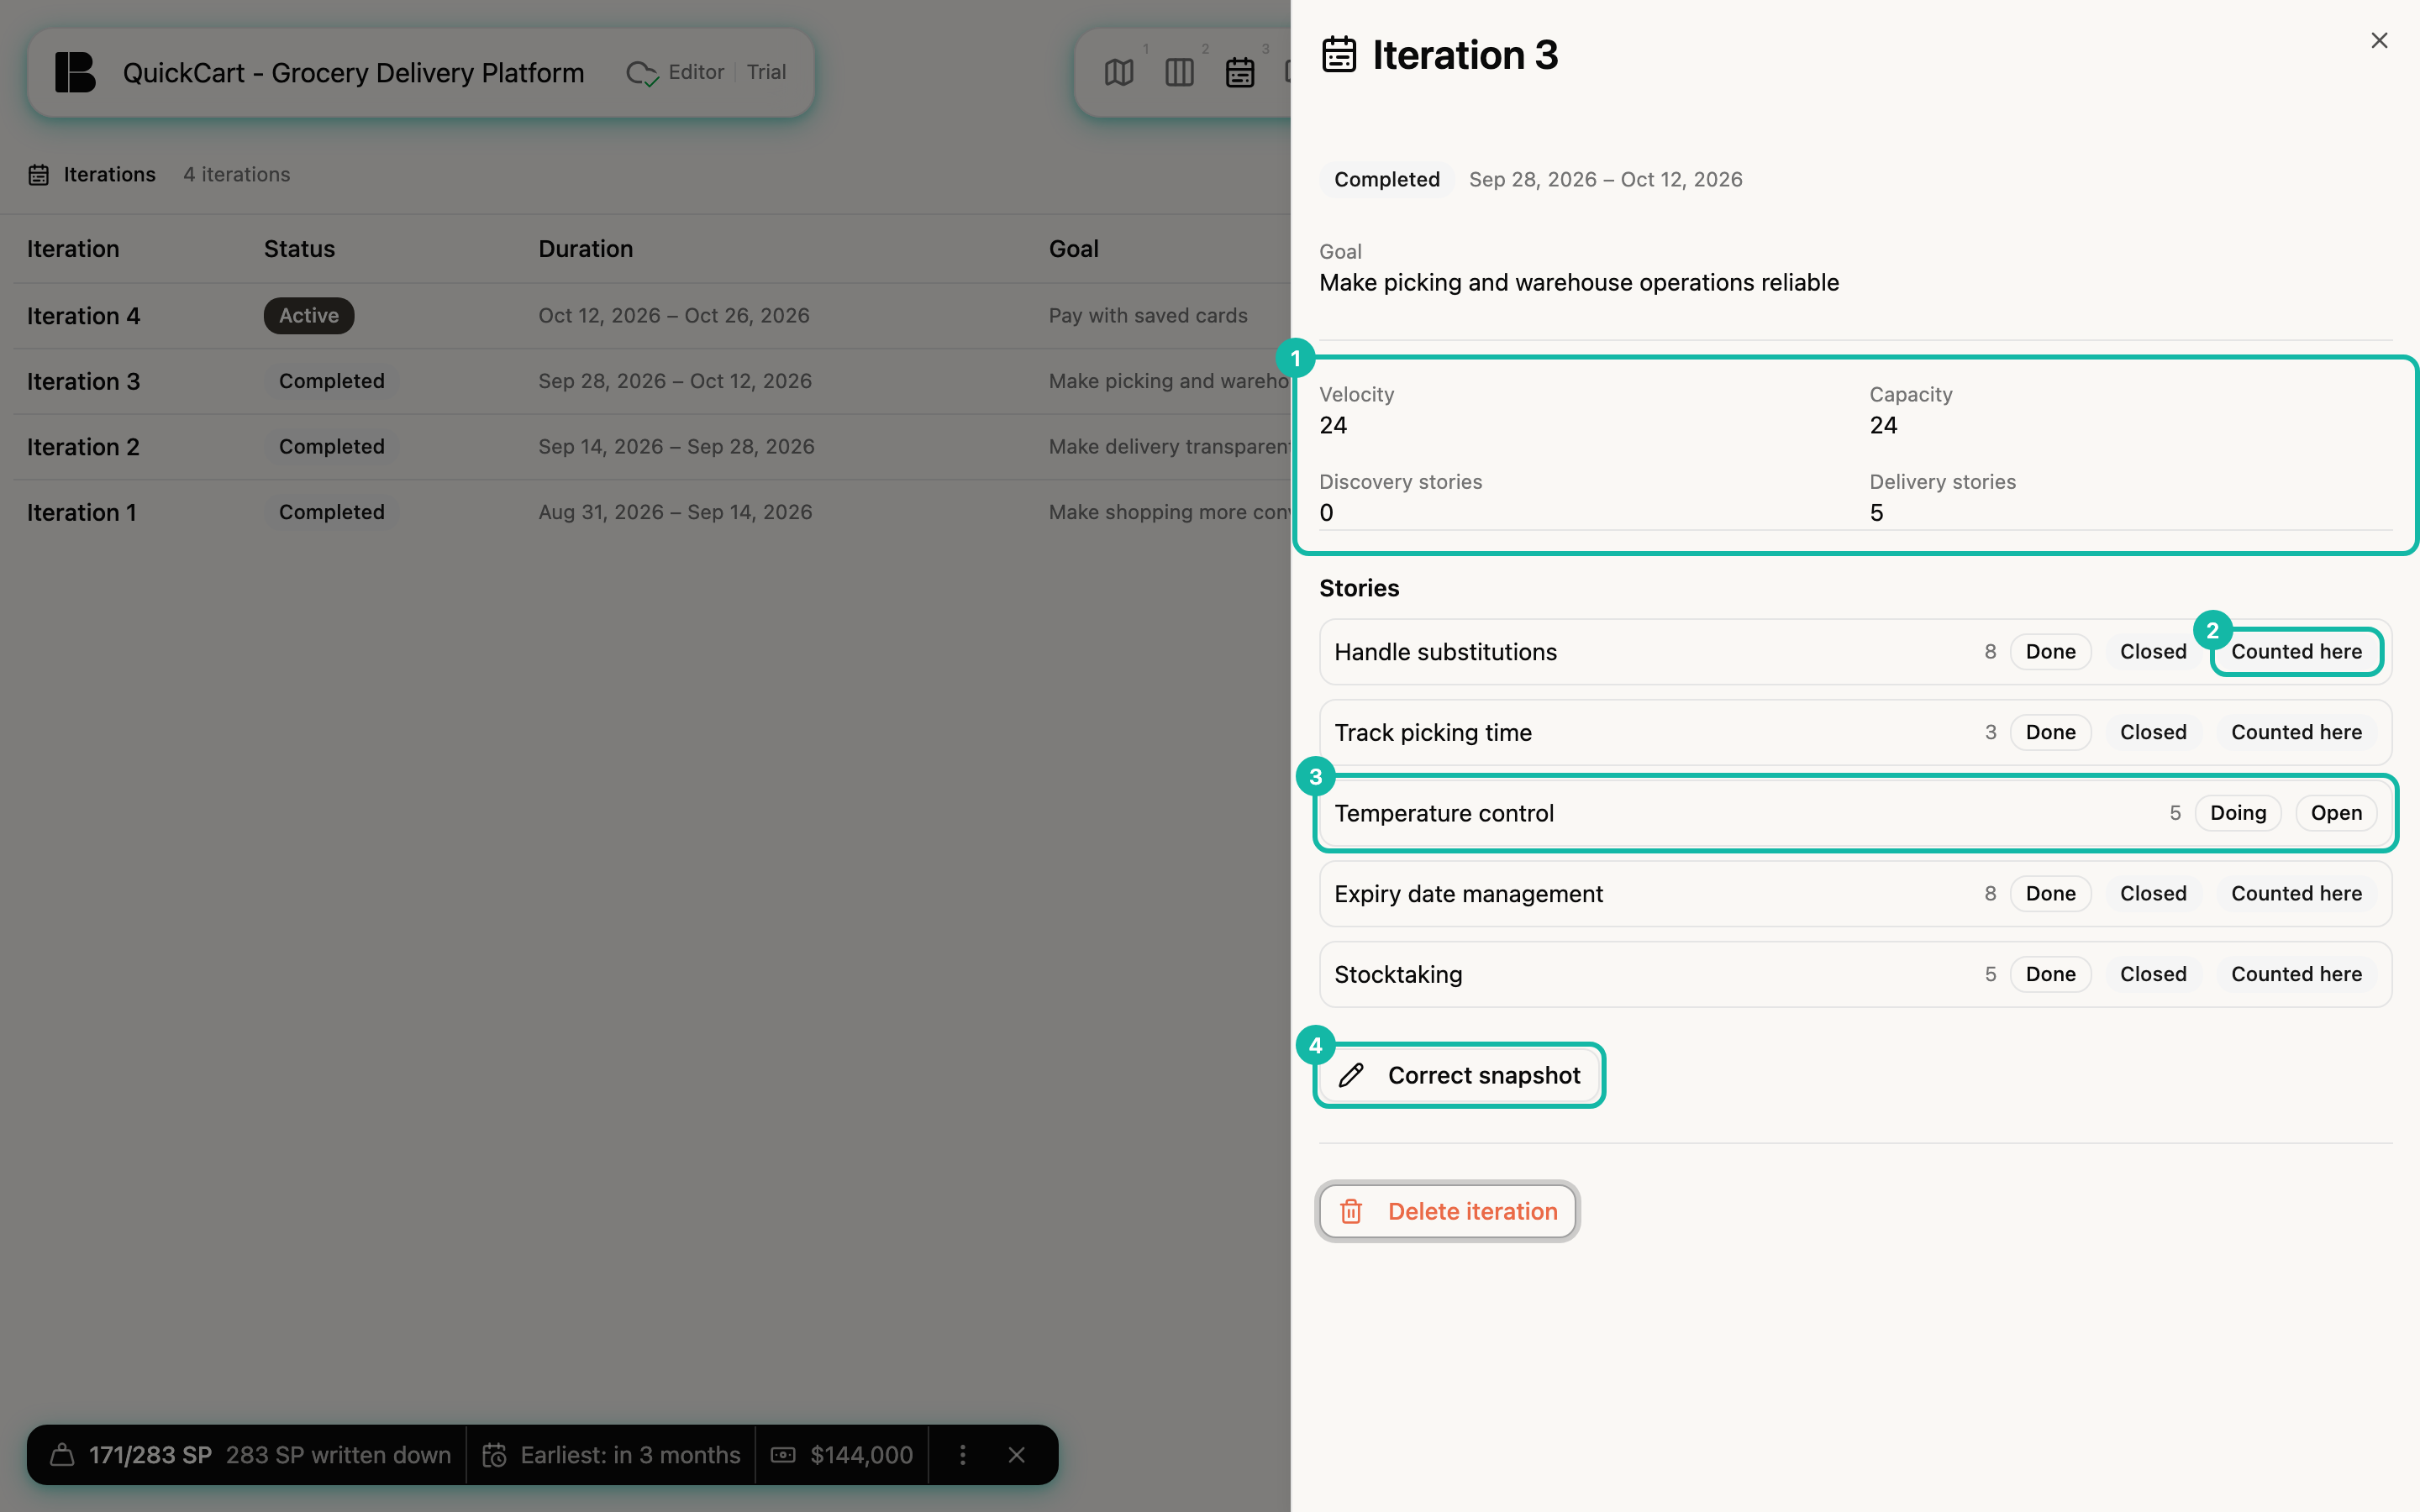
The panel shows status, period, Goal, Velocity, Capacity, Discovery stories and Delivery stories, plus the iteration's Stories.
- Running iteration: The stories come live from the board.
- Completed iteration: The stories come from the snapshot, as they stood at completion. With state, estimate and the label Counted here (this iteration counts the points) or Counted elsewhere (another iteration counts them).
- now: If a story changed since completion (estimate, state, closed), a second line shows today's state, for example now: Done Closed on a story that was still open at completion. In QuickCart no story has changed, so the screenshot doesn't show this line. These differences are what lead to a snapshot correction.
- If the iteration was closed before Betterplan kept the stories, it reads The stories of this iteration were not recorded.
From here you can Correct snapshot and Delete iteration (see Iterations).