Estimating
A Story is only plannable once you know roughly how big it is. Betterplan estimates in Story Points, right on the card, without you having to copy numbers into another tool. From the points, your team's velocity and the cost per Iteration, the Estimation Widget continuously works out when you will be done and what that costs. The basics, that is why we estimate relatively and what velocity means, are covered in Estimating: the basics. This page shows how to do it in Betterplan.
Betterplan automatically counts every Story without an estimate of its own with a provisional value, the median of the existing estimates. Estimate as a Story matures, not in advance. Details are in Automatic estimates.
Assigning Story Points
You estimate User Stories. Dev and Project Stories and Workitems have no points.
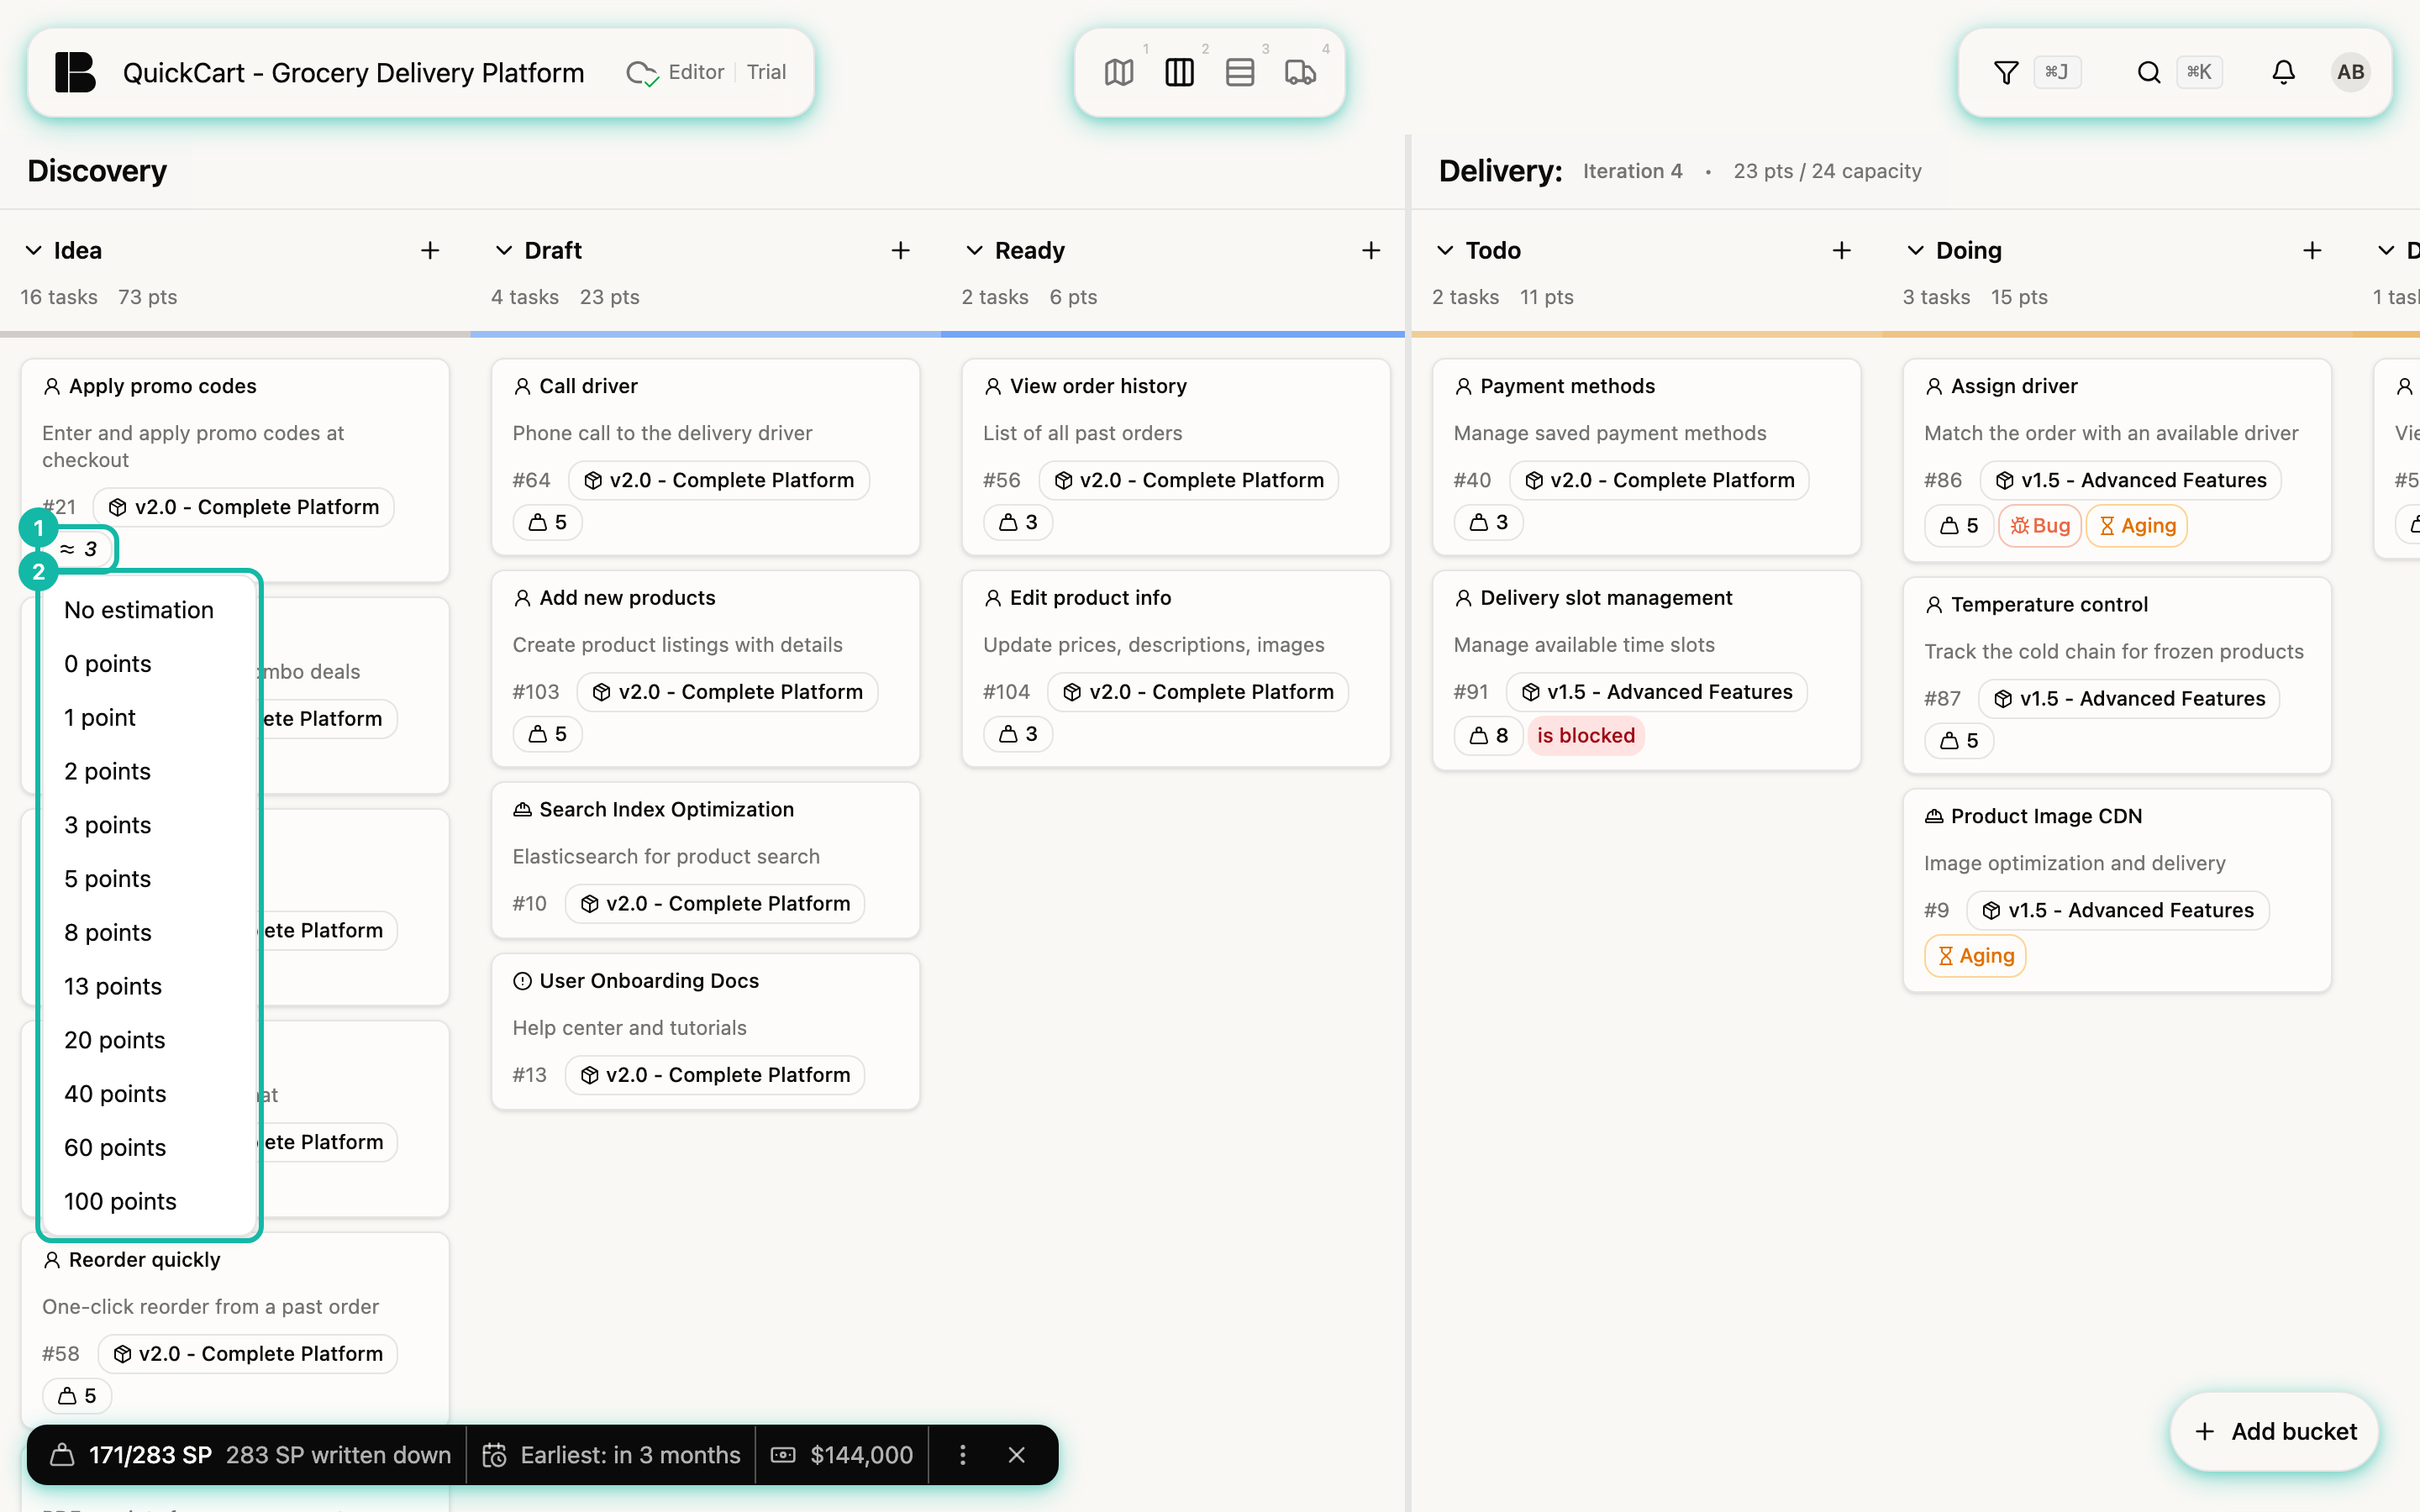
- In Prepare, find a Story without an estimate. In QuickCart that is for example Apply promo codes in the Idea column. Instead of a number, the card shows ≈ 3: that is not an estimate by you but the median of all estimates in the project so far, which Betterplan uses provisionally (see Automatic estimates). You don't have to do anything here, the Story already counts.
- If you want to estimate it yourself, click this indicator. A list opens with No estimation and the values of the scale, from 0 points to 100 points.
- Choose the value. The number appears on the card right away and the widget recalculates. With No estimation you remove your estimate again, and the provisional value applies once more.
You find the same selection on the cards in the Storyboard and in a Story's details. For many Stories at once, the List has the Estimation action. The Estimation View sorts Stories by size and suits estimating together.
Allowed are 0, 1, 2, 3, 5, 8, 13, 20, 40, 60 and 100. A value in between, such as 4, does not exist, because it would claim a precision nobody has. 0 means "agreed to be free" and is different from No estimation.
Provisional values instead of gaps
Which Stories you estimate yourself is up to you. All the others count with the median: in the indicator, in the Estimation Widget, in the forecast and in the cost. The widget therefore calculates even when only part of the Backlog has an estimate of its own. How the value arises, when an estimate of your own pays off and how you override it is explained in Automatic estimates.
The Estimation Widget
The widget is being rolled out gradually. If you don't see it yet, it hasn't been enabled for your workspace. The estimate selection on the cards does not depend on it.
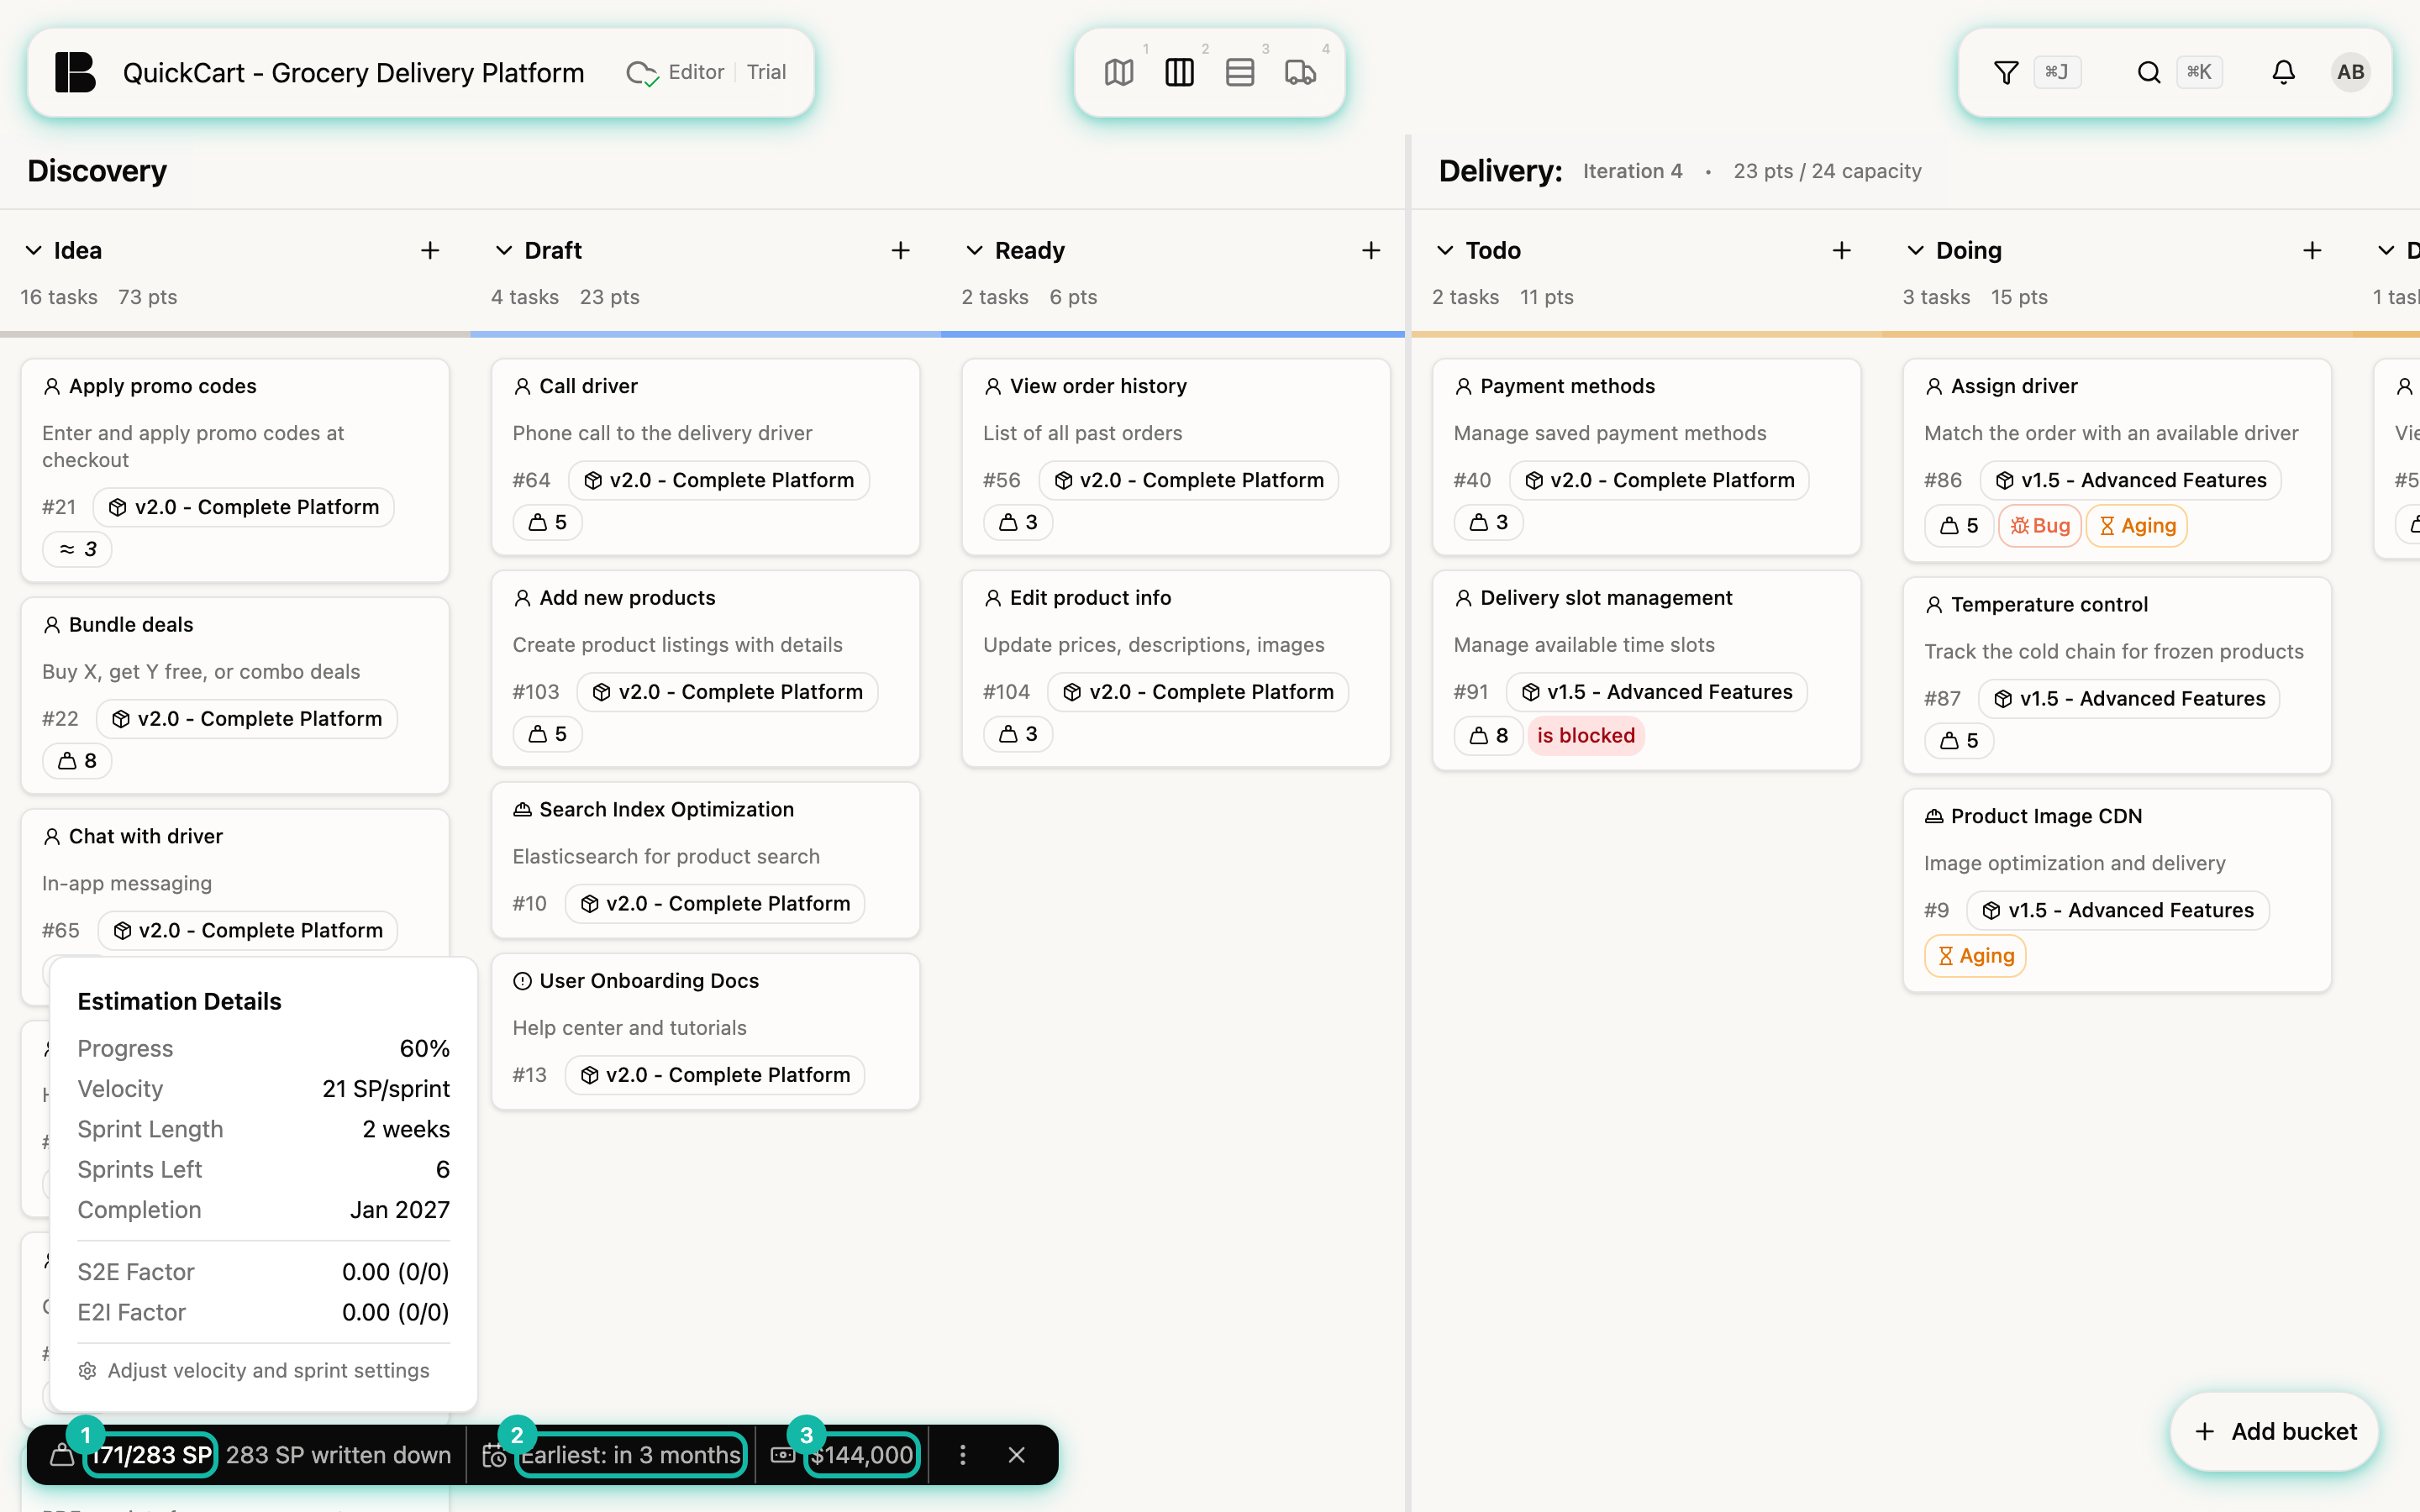
A dark bar floats at the bottom left. It shows at a glance where the project stands.
| Part | Meaning |
|---|---|
| 171/283 SP | Done points out of all points. Written-down Stories count (see Rapid Estimation for the extrapolation) |
| Earliest: in 3 months | Forecast of when everything can be done, from the remaining points and the velocity |
| Amount on the right | Expected remaining cost: the Iterations needed for the remaining points times the cost per Iteration |
Hover over the bar and the Estimation Details open: Progress, Velocity, iteration length, remaining iterations, Completion as well as the S2E Factor and E2I Factor of the extrapolation. The cross in the bar folds it into a round icon, and a click on that opens it again. If a filter is active, the widget calculates points, remaining points and amount for the visible Stories only, and a triangle warns you: the forecast still relies on the velocity of the whole project. That lets you play through what a section costs (see Filters apply everywhere).
Setting the prerequisites
The widget needs a few inputs, otherwise forecast and amount are missing. You find them in the project settings, reachable through the command palette (Open Settings) or through the link at the end of the tooltip:
- Team tab: Velocity (Story Points per Iteration), Iteration Length (Weeks), Budget and Cost per Iteration.
- General tab, Display Settings: Show Estimation Details turns the widget on and off. The widget also only appears once the project has points.
When you complete Iterations, Betterplan replaces the velocity you entered with the average of the last three completed Iterations. The starting value is therefore an assumption for the beginning that real data replaces by itself. The dialog for completing an iteration still mentions a median (Project velocity (median)); the calculation uses the average.