Flow metrics: how fast and how reliably does the team deliver?
This view is being rolled out gradually. If you don't see it yet, it hasn't been enabled for your workspace.
Progress tells you whether you will finish. The Flow view shows why it goes as fast or as slowly as it does: How long does a story take, where does it wait, and how safely can you promise a date? It works only with the timestamps Betterplan sets anyway when you move stories across the board (see Lead times). You maintain nothing extra and don't need to estimate a single story. The view is in the Insights phase (shortcut 4 3).
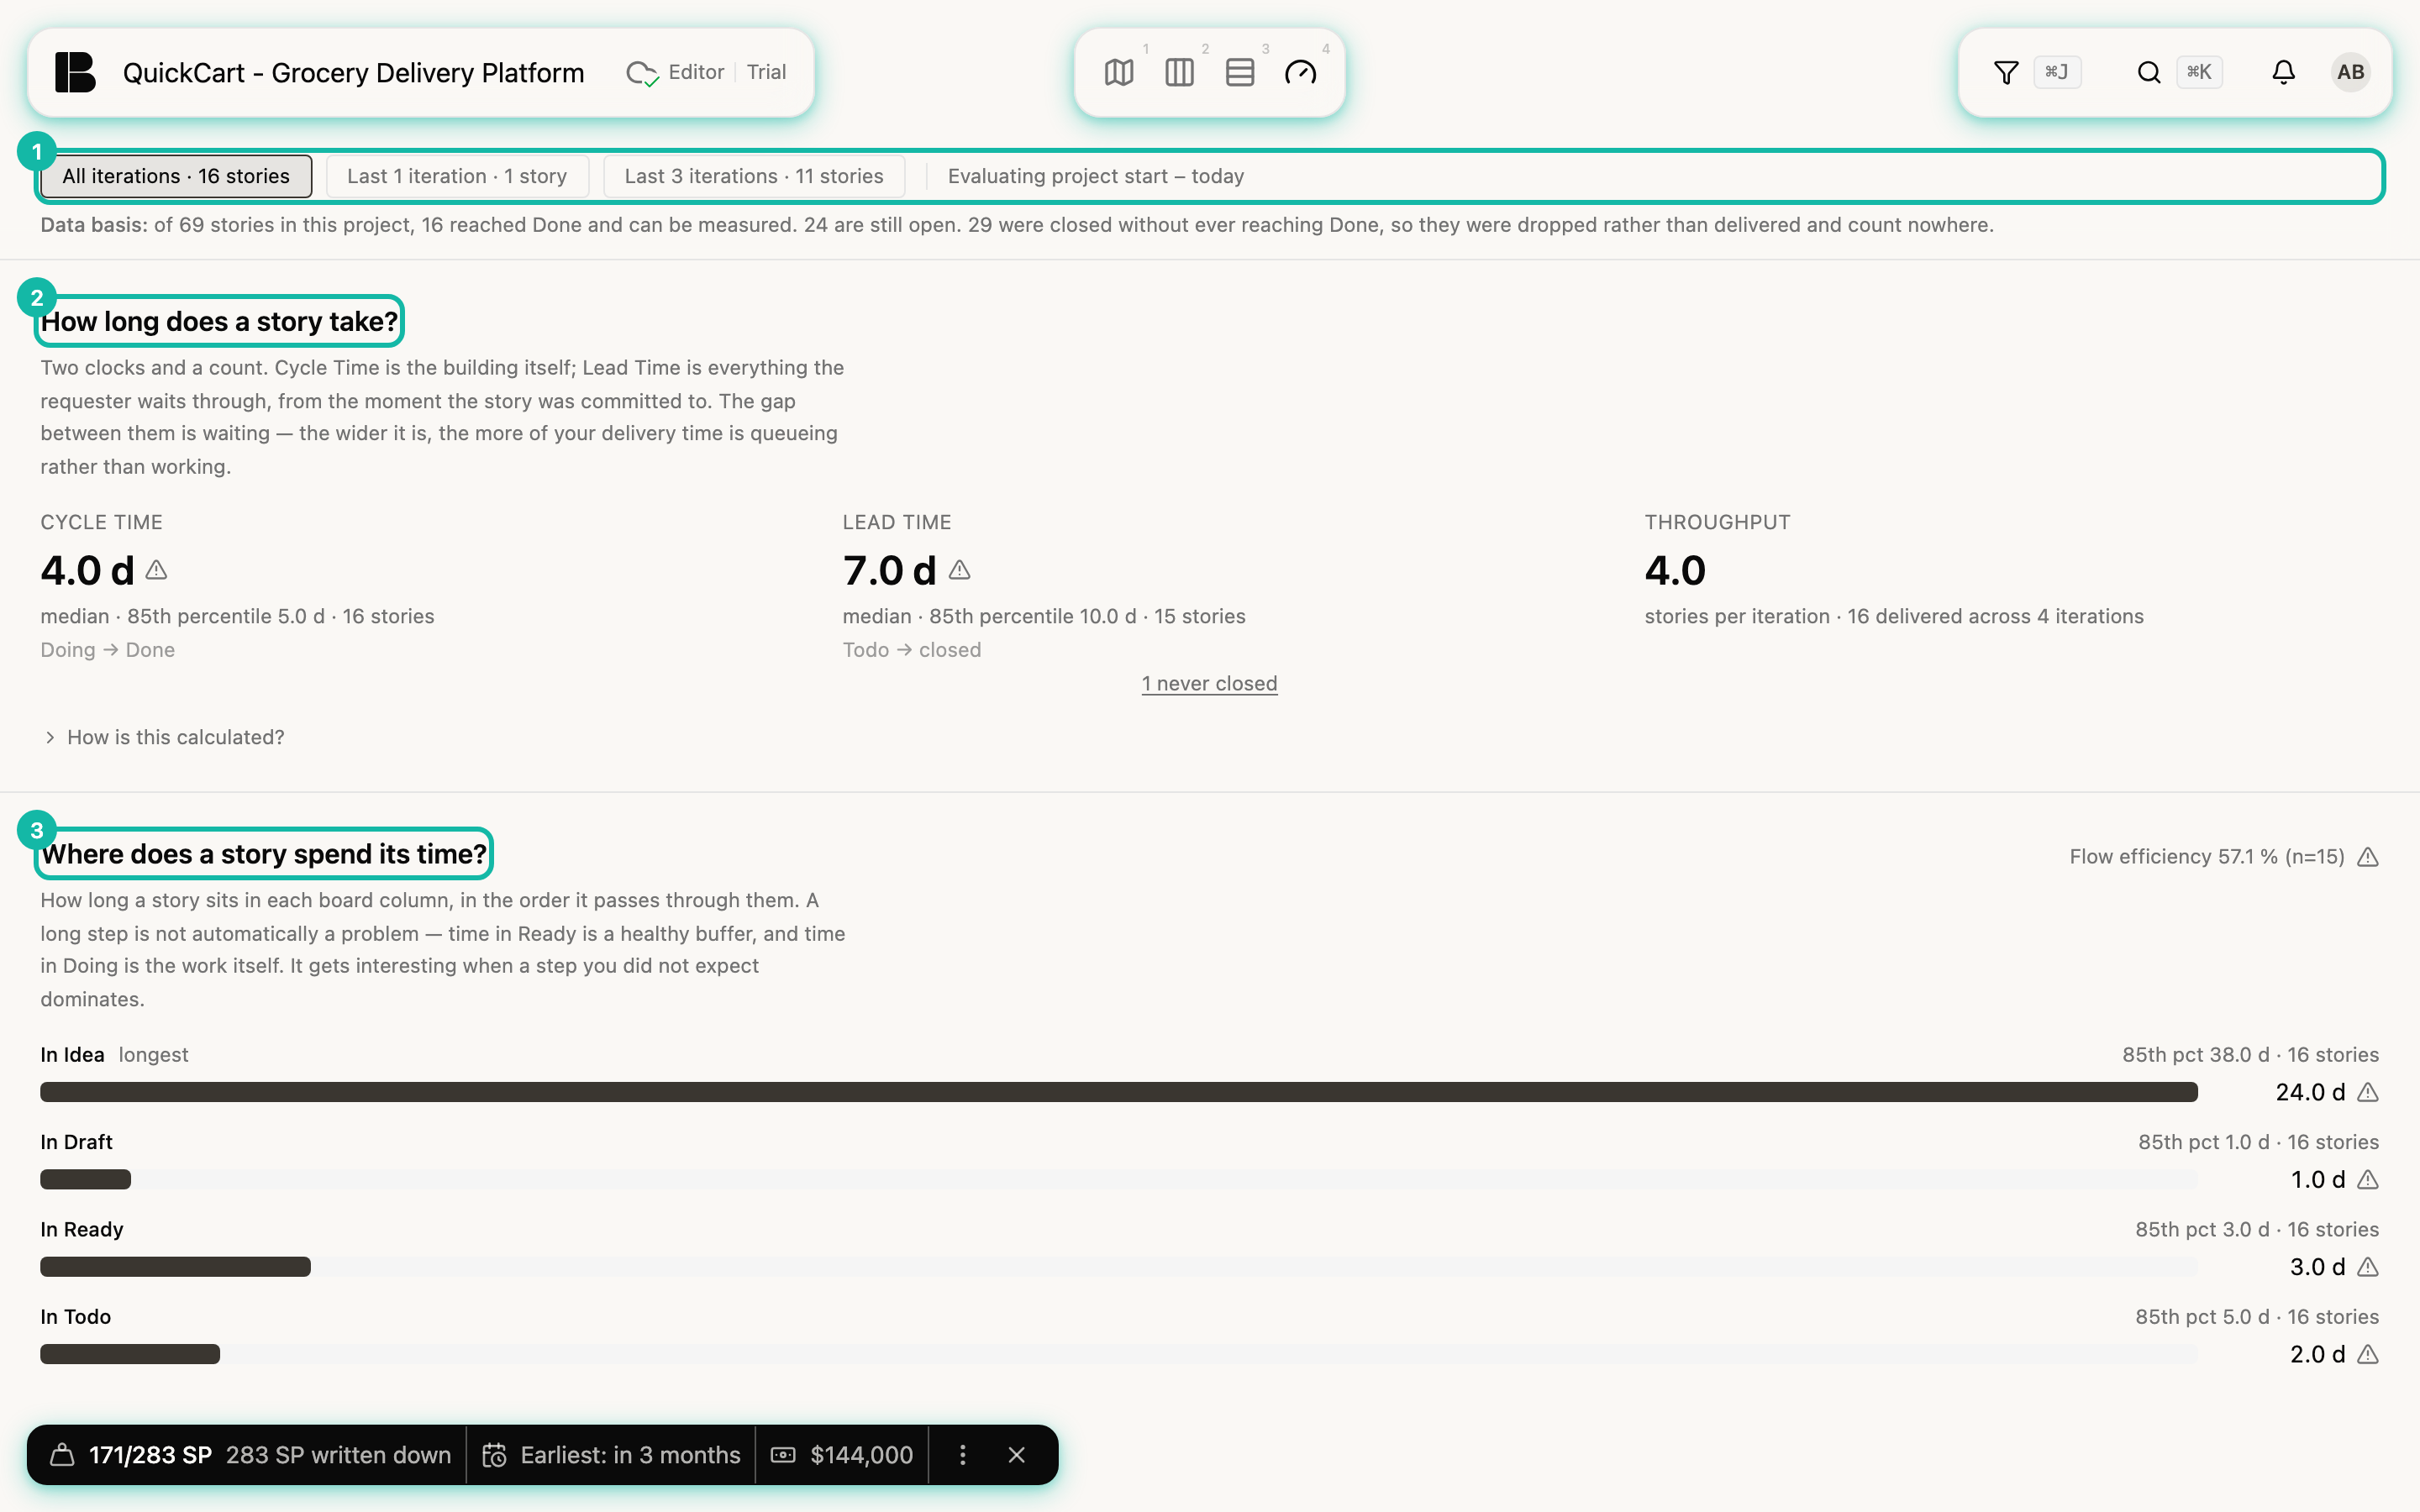
Range and data basis
At the top you choose the range: All iterations or the last few iterations. Each button states how many delivered stories it rests on, for example Last 1 iteration · 1 story. A range with only a few stories says little, which is why the number is shown up front. To the right it says which days are evaluated (Evaluating project start – today). The choice applies only to you and only on this page; it changes neither the Storyboard nor any board.
Below it, the data basis explains what is counted: in QuickCart, of 69 stories, 16 are done and therefore measurable, 24 are still open, and 29 were closed without ever reaching Done. Discarded stories count nowhere, otherwise the numbers would look better the more you discard. The unit is always the story, never the workitem.
If a filter is active, all values apply only to the delivered stories matching it, and a notice above the view says so. That way you can evaluate a single Iteration, an Epic or a tag, see Filters apply everywhere.
How long does a story take?
Two clocks and a count:
| Figure | Measured from … to … | What it tells you |
|---|---|---|
| Cycle Time | Doing → Done | How long the actual building takes |
| Lead Time | Todo → closed | What the requester waits for from the promise onward |
| Throughput | counted per iteration | How many stories get finished per iteration, without any estimate |
Todo is the commitment point: from here the team has committed to the story, before that it is only an option (see States). The gap between lead time and cycle time is waiting time. The larger it is, the more of your delivery time is queue rather than work.
In QuickCart the cycle time is 4.0 days (85th percentile 5.0 d), the lead time 7.0 days and the throughput 4.0 stories per iteration (16 stories across 4 iterations). Below the lead time it says that one story was never closed and therefore does not count there.
All durations are the median, complemented by the 85th percentile. The median is the middle story: one half was faster, the other slower. The 85th percentile is the value 85 out of 100 stories did not exceed, the number for “reliable up to”. An average would be pulled up by a few very long stories and make the normal case look worse than it is. The expandable line How is this calculated? explains the rules in more detail.
The warning sign next to a value means it rests on fewer than about twenty stories and swings strongly when a single unusual story is added or removed. Treat it as an order of magnitude, not an exact measurement. QuickCart has only 16 delivered stories, so almost every value carries the sign.
Where does a story spend its time?
The bars show how long a story stays in each board column, as a median: In Idea, In Draft, In Ready, In Todo, In Doing, In Done. Next to each is the 85th percentile and the number of stories. The longest column carries the note longest; in QuickCart that is the idea stage with 24 days. At the top right is the Flow Efficiency: the share of time spent in doing out of the time from todo to closed.
A long step is not automatically a problem. Time in In Ready is a healthy buffer, time in In Doing is the work itself. It gets interesting when a step dominates that you didn't expect, for instance a lot of time in In Todo (more committed than started) or in In Done (stories waiting for acceptance).
If someone drags a story straight from Idea to Todo, Betterplan writes the timestamps for Draft and Ready at the same moment. The step then has no duration and shows as Not recorded. That is not a defect; it shows that your stories don't pass through this step as a move of its own. The bars also don't add up to a total duration: medians cannot be added.
How reliable is a delivery date?
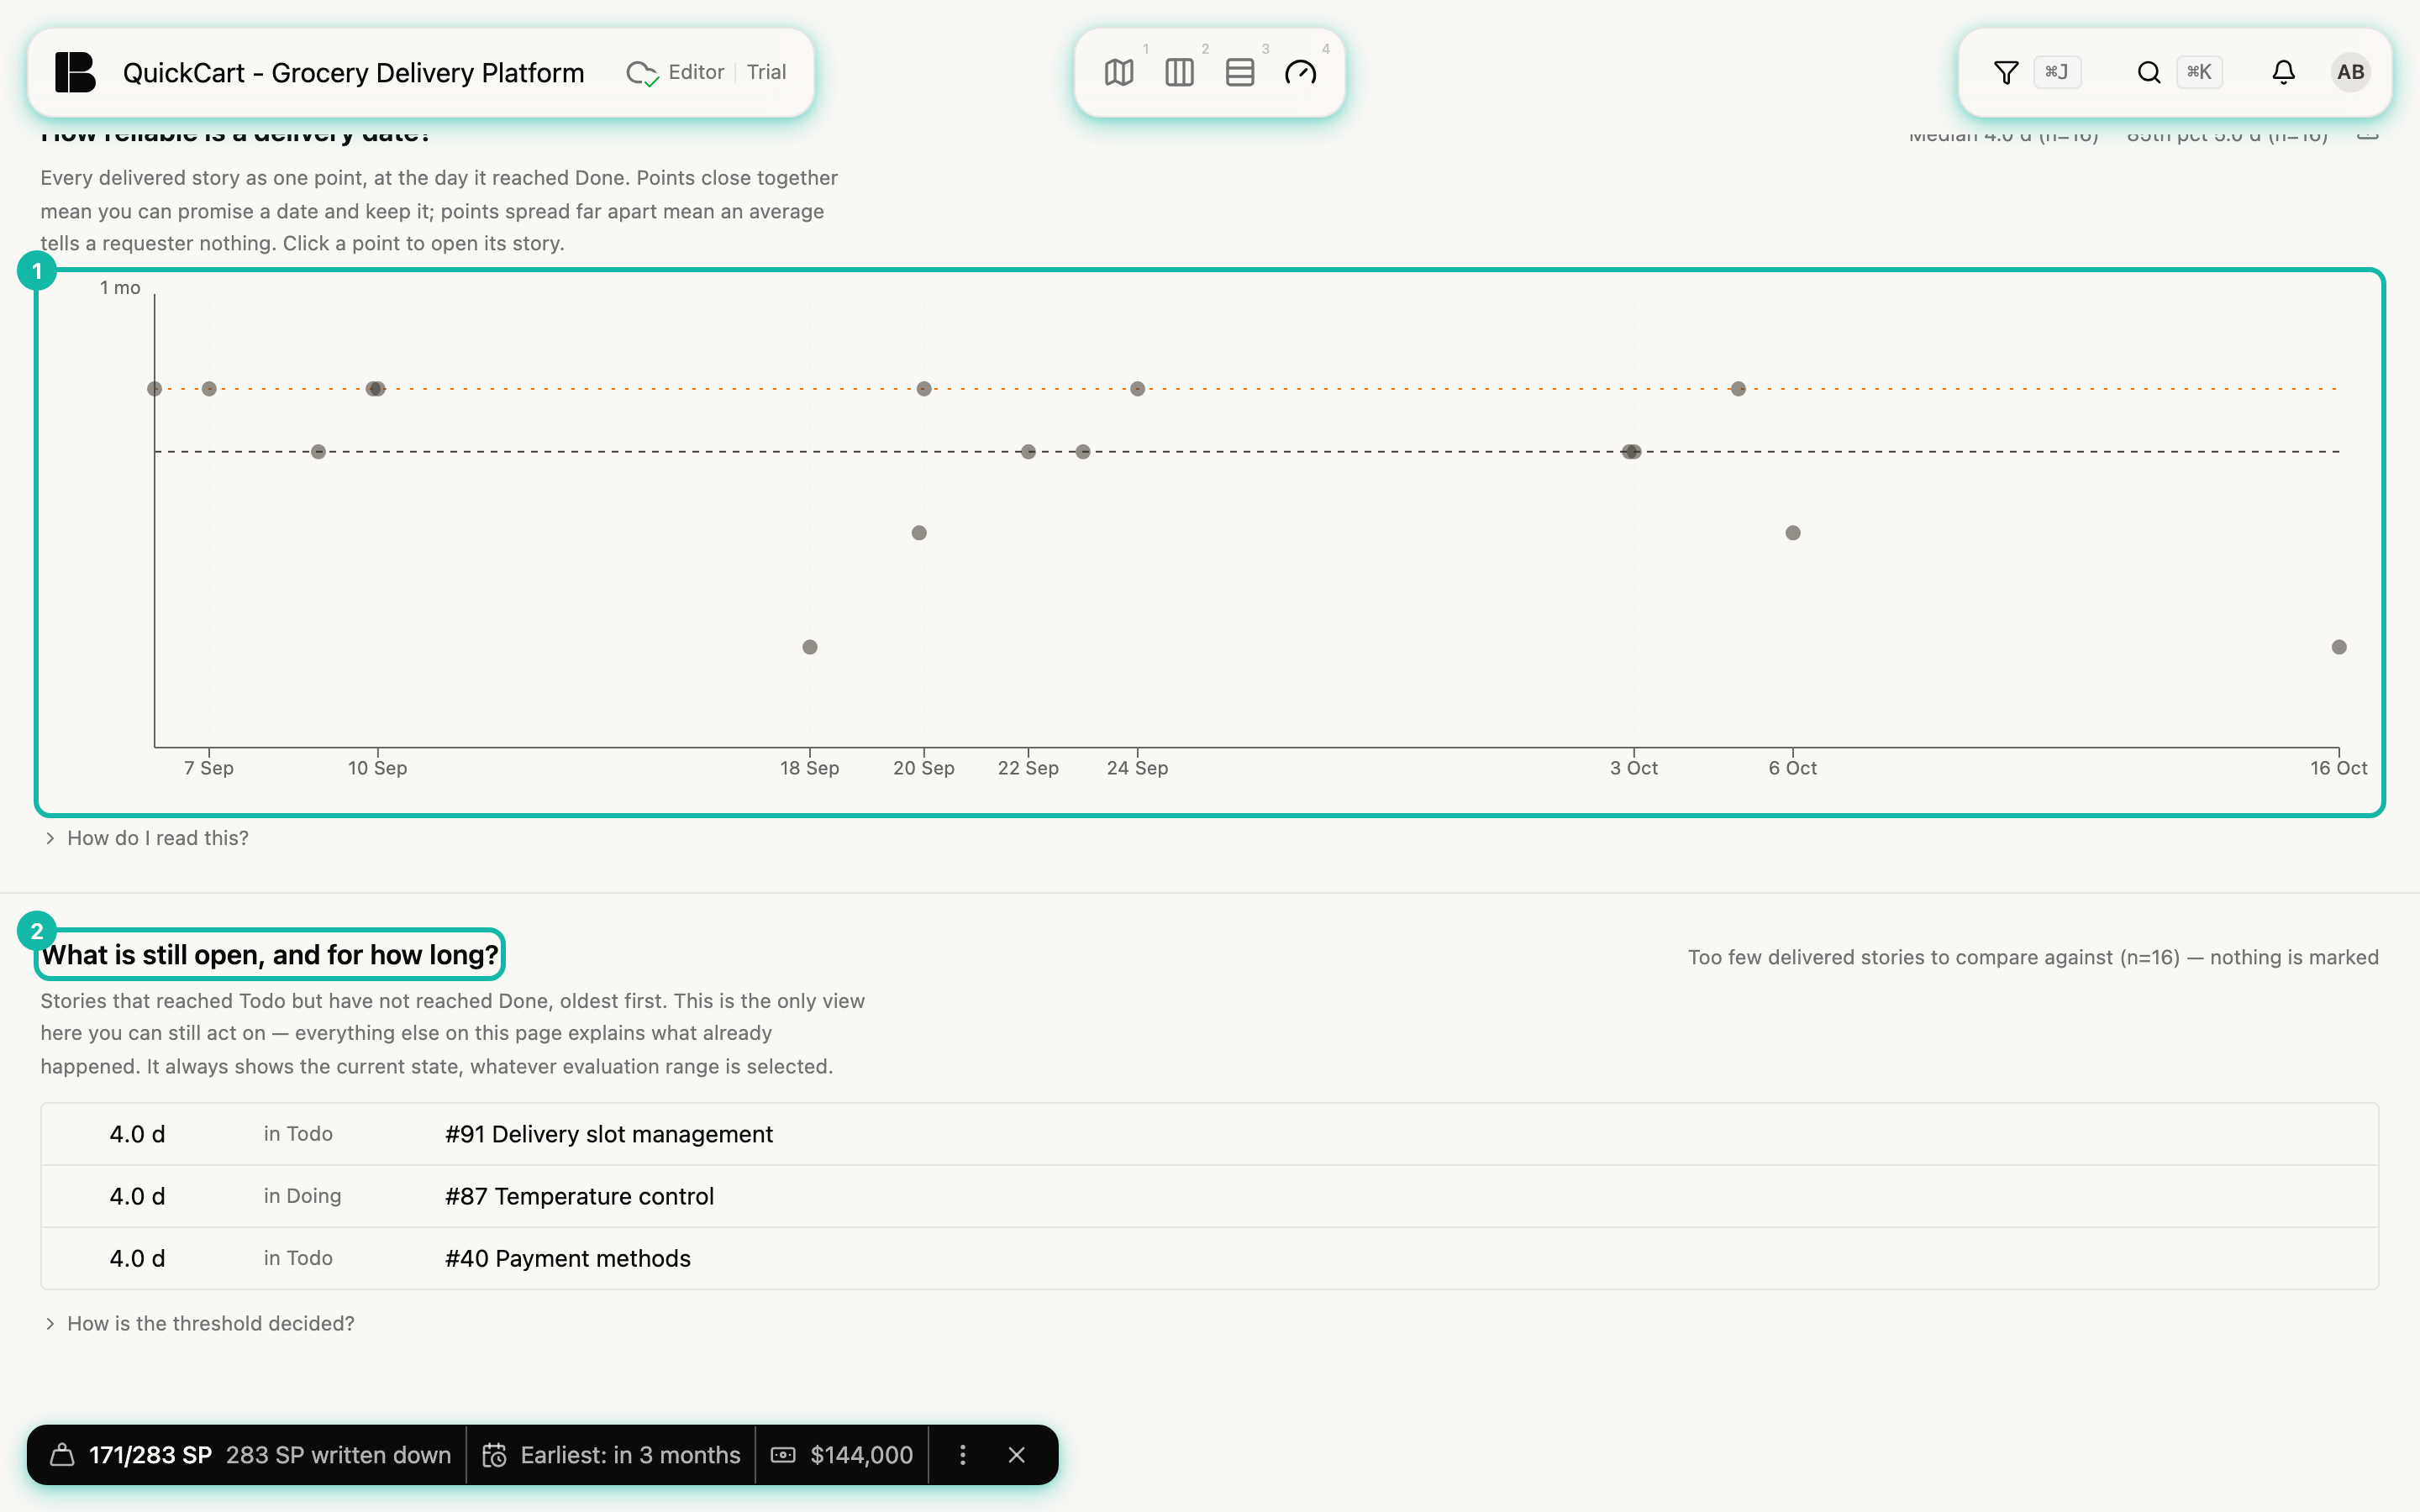
Scroll further and the spread follows: each delivered story is a dot, horizontally at the day it reached Done, vertically by its cycle time. Two lines show the median (dashed) and the 85th percentile (dotted). If the dots lie close together, you can promise a date and keep it. If they are scattered widely, an average tells you nothing. A click on a dot opens the story. The vertical axis is logarithmic, each tick roughly ten times the one below; How do I read this? explains the details.
What is still open, and for how long?
The list shows stories that reached Todo but are not yet Done, oldest first, with their age, state (in Todo or in Doing) and title. This is the work currently in flow (work in progress, WIP): the longer the list and the older its entries, the more work is piling up. It is the only part of the view you can still influence, since everything else describes the past. The list always shows the current state and ignores the selected range.
Betterplan flags a story as conspicuous only once it is older than the 85th percentile of the stories delivered so far. With fewer than twenty comparable stories it flags nothing and says so openly, in QuickCart: Too few delivered stories to compare against. This is something different from the aging signal on the ticket card: that one measures how long a story has stood still, the list here how long it has been promised.