Progress: will we make it?
This view is being rolled out gradually. If you don't see it yet, it hasn't been enabled for your workspace.
The first question every stakeholder asks is: Will we finish, and when? The Progress view answers it on one page. It puts the scope (everything that is to be built) next to what is already done and extends the line into the future. You reach it through the Insights phase of the floating navigation, view Progress (shortcut 4 2, see Views).
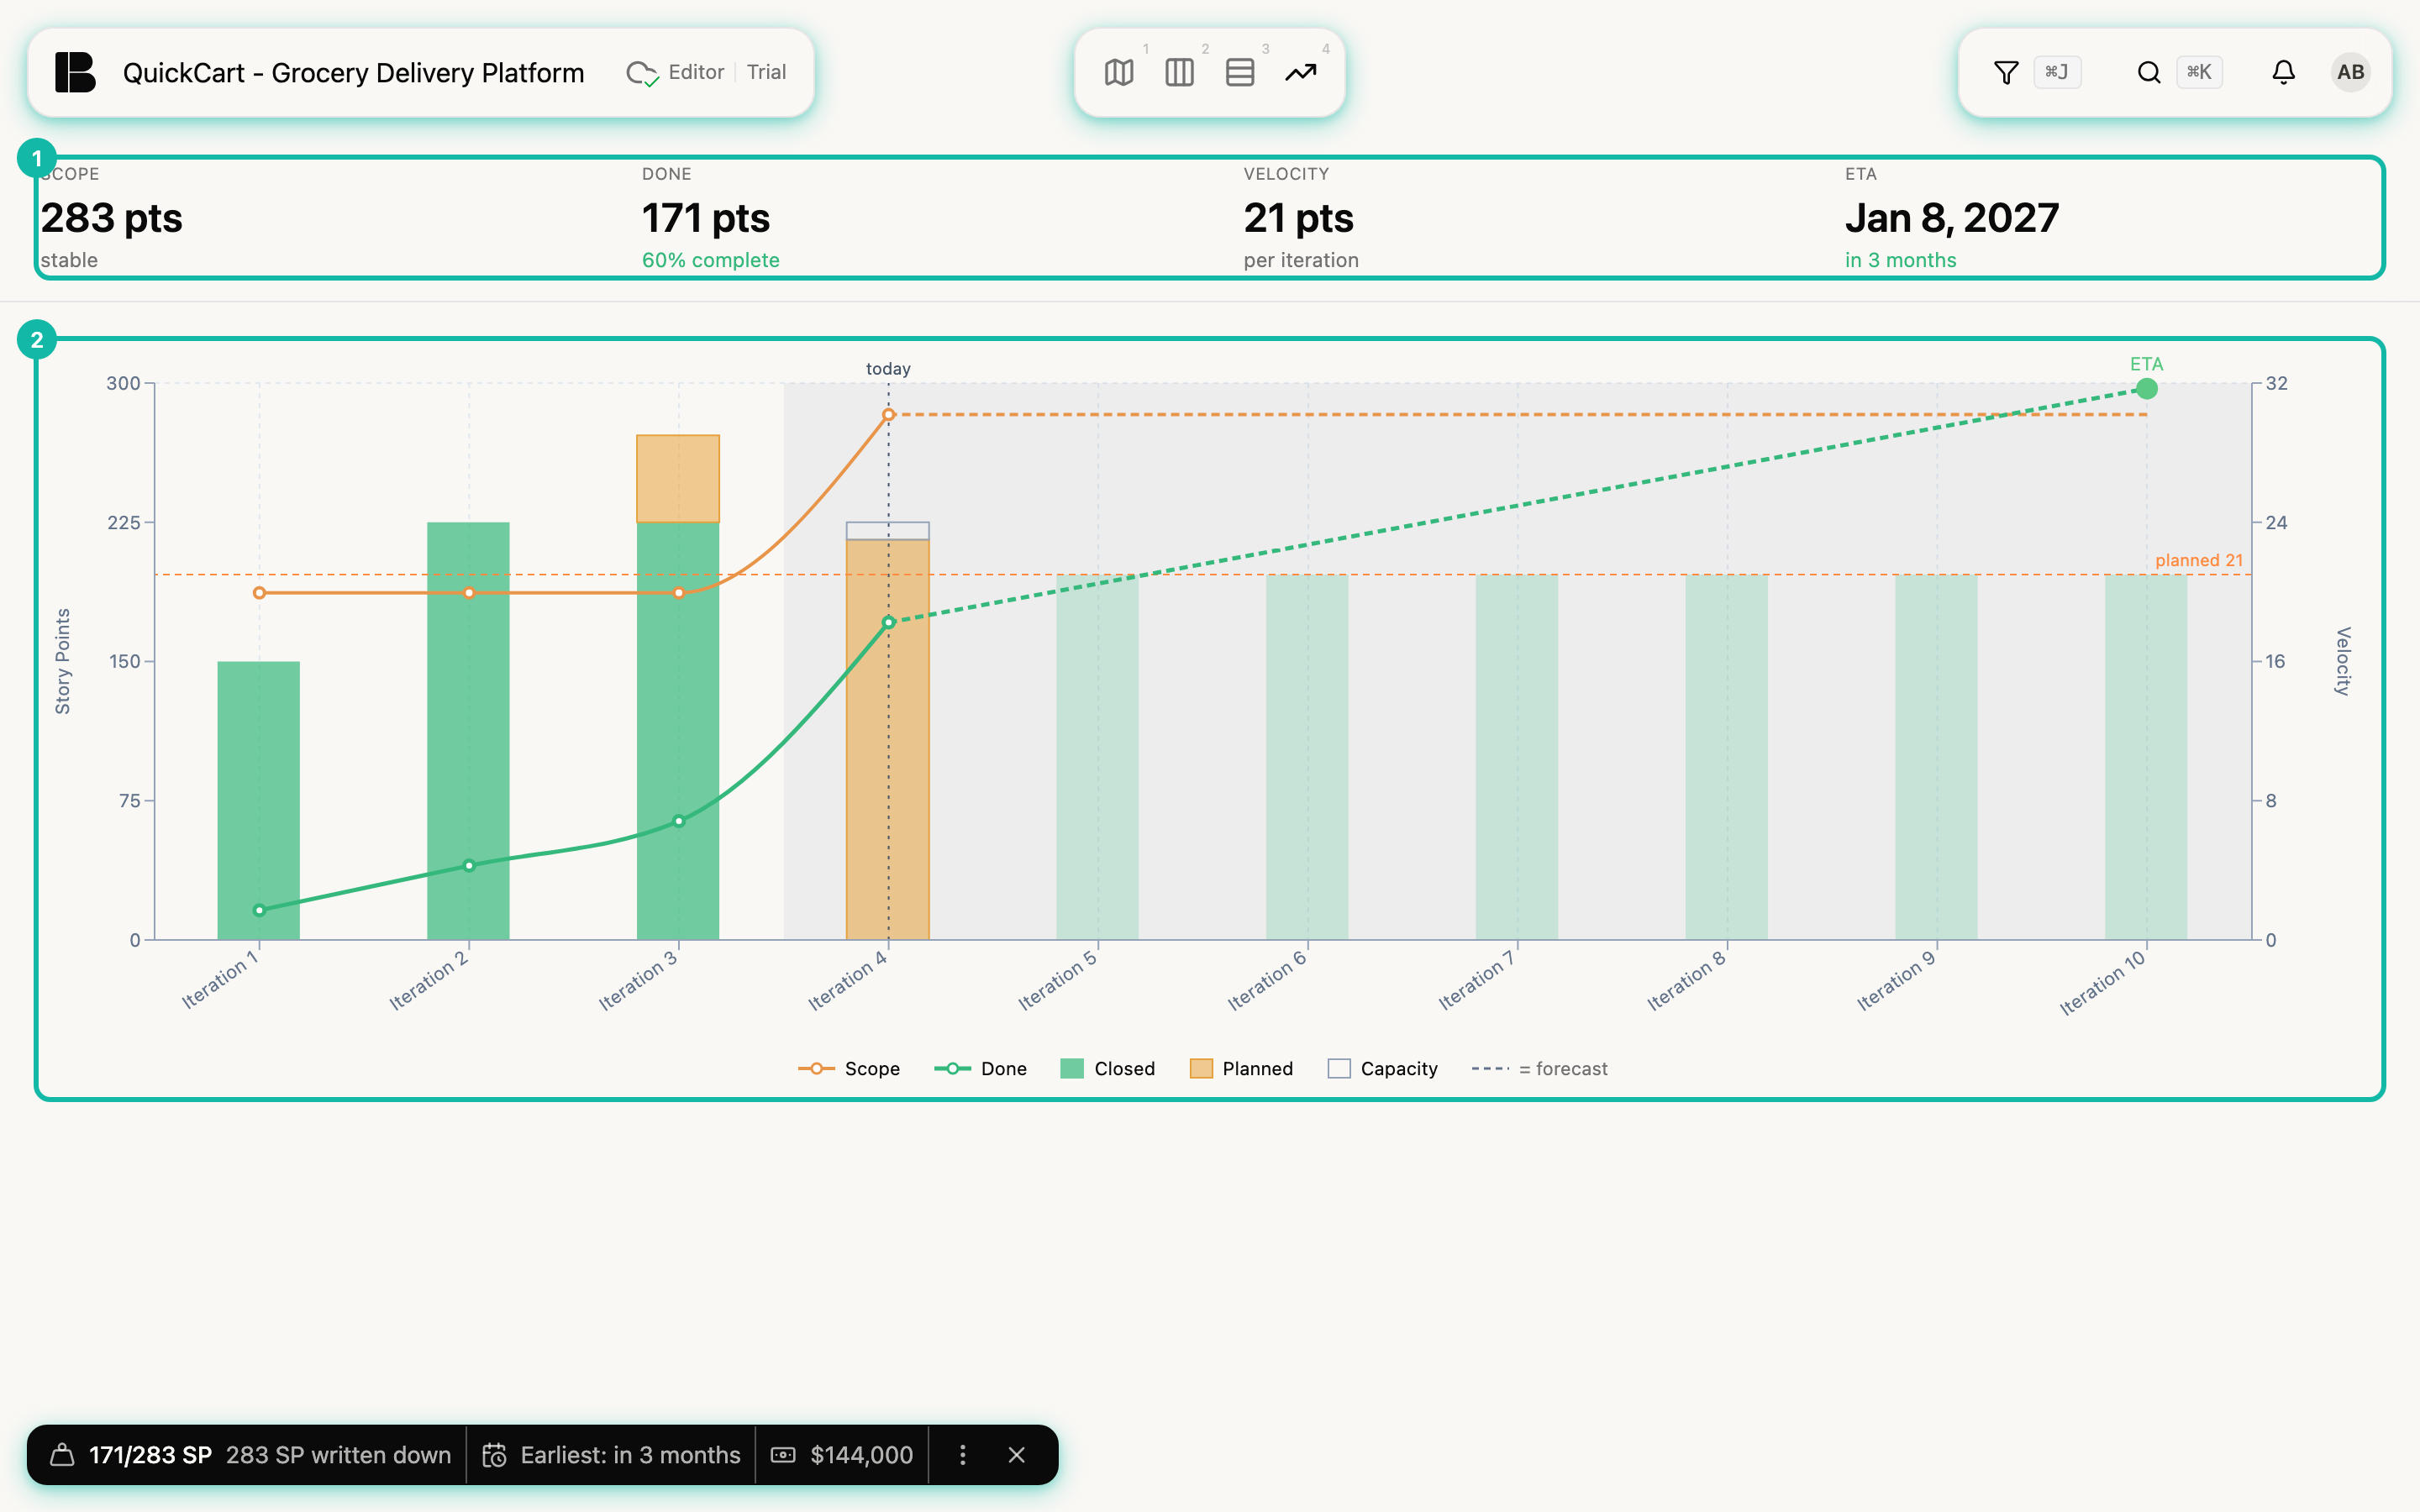
The figures
| Figure | Meaning |
|---|---|
| Scope | All story points of the user stories in the project, done and open. Below it you see stable or the average growth per iteration |
| Done | Story points of the delivered stories, plus their share of the scope in percent |
| Velocity | The velocity the forecast uses (average of the last three completed iterations, see Estimating). If the observed value differs, it appears below as observed |
| ETA | Expected completion date and how far away it is |
Scope, done and remaining points are the same numbers as in the bar at the bottom left, the Estimation Widget. If you switched on Rapid Estimation there, the widget shows an extrapolation, while the figures here stay with the stories actually written. The chart measures what happened and extrapolates nothing.
Reading the chart
The horizontal axis is iterations. Completed ones are on the left, the vertical line today marks the running one, and forecast points follow on the right, up to six iterations ahead.
- Scope (orange line) and Done (green line) are measured on the left axis in Story Points. The gap between them is the work still ahead.
- The bars belong to the right axis Velocity: Closed (green) is what the iteration delivered. Planned (orange) and Capacity (grey outline) show how much was intended.
- Dashed lines and pale bars, labelled = forecast in the legend, are calculated rather than measured values.
- The large dot at the end of the dashed line is labelled ETA: the moment the done line reaches the scope. The horizontal line planned 21 is the velocity used for the calculation.
How a date results from velocity and scope growth is explained in How Betterplan forecasts.
Hover over a point and a tooltip shows the values of that iteration, marked (forecast) for forecast points and (running) for the current one.
The points of completed iterations come from the snapshots Betterplan records when you complete an iteration. They never change again, even if you later delete or re-estimate stories. The point for “today”, by contrast, is always calculated fresh from the current stories, so the two can differ. In QuickCart this is clearly visible: many stories were already done before the first iterations were closed cleanly, so the green line jumps up at the last point. That is a quirk of the example data. If today's value is lower than the last history point, a notice above the chart points it out and explains the cause.
Notices above the chart
Betterplan tells you when the forecast has to be read with care:
- Forecast based on fewer than 3 iterations — confidence is low. The velocity then rests on few measurements.
- At current pace, scope grows faster than delivery. Betterplan then draws no forecast, because a line that never arrives is not a date.
- Configure velocity in settings to see a forecast. Without a velocity there is nothing to extend.
- Filtered view … appears when a filter is active (see below).
With a filter: how far along is release X?
Filters turn Progress into an evaluation for any section: an Epic, a Release, a tag. More ideas are under Filters apply everywhere.
With a filter active, Progress recalculates scope, done and forecast for the visible stories only. That answers, for example, how far along a particular release is. Two limits are intentional: the history of completed iterations disappears because it cannot be recomputed retroactively for a filter, and the forecast still uses the velocity of the whole project. That is why the notice warns that the estimate may be too optimistic.
No iteration completed yet?
Then Progress shows Complete your first iteration to see progress instead of the chart. Without a snapshot there is no history yet.
Settings such as velocity, iteration length, budget and cost per iteration are reachable through the command palette (Open Settings) or through the link in the tooltip of the Estimation Widget, which also appears at the bottom left here.