Delivery Timeline and timeline notes
This view is being rolled out gradually. If you don't see it yet, it hasn't been enabled for your workspace.
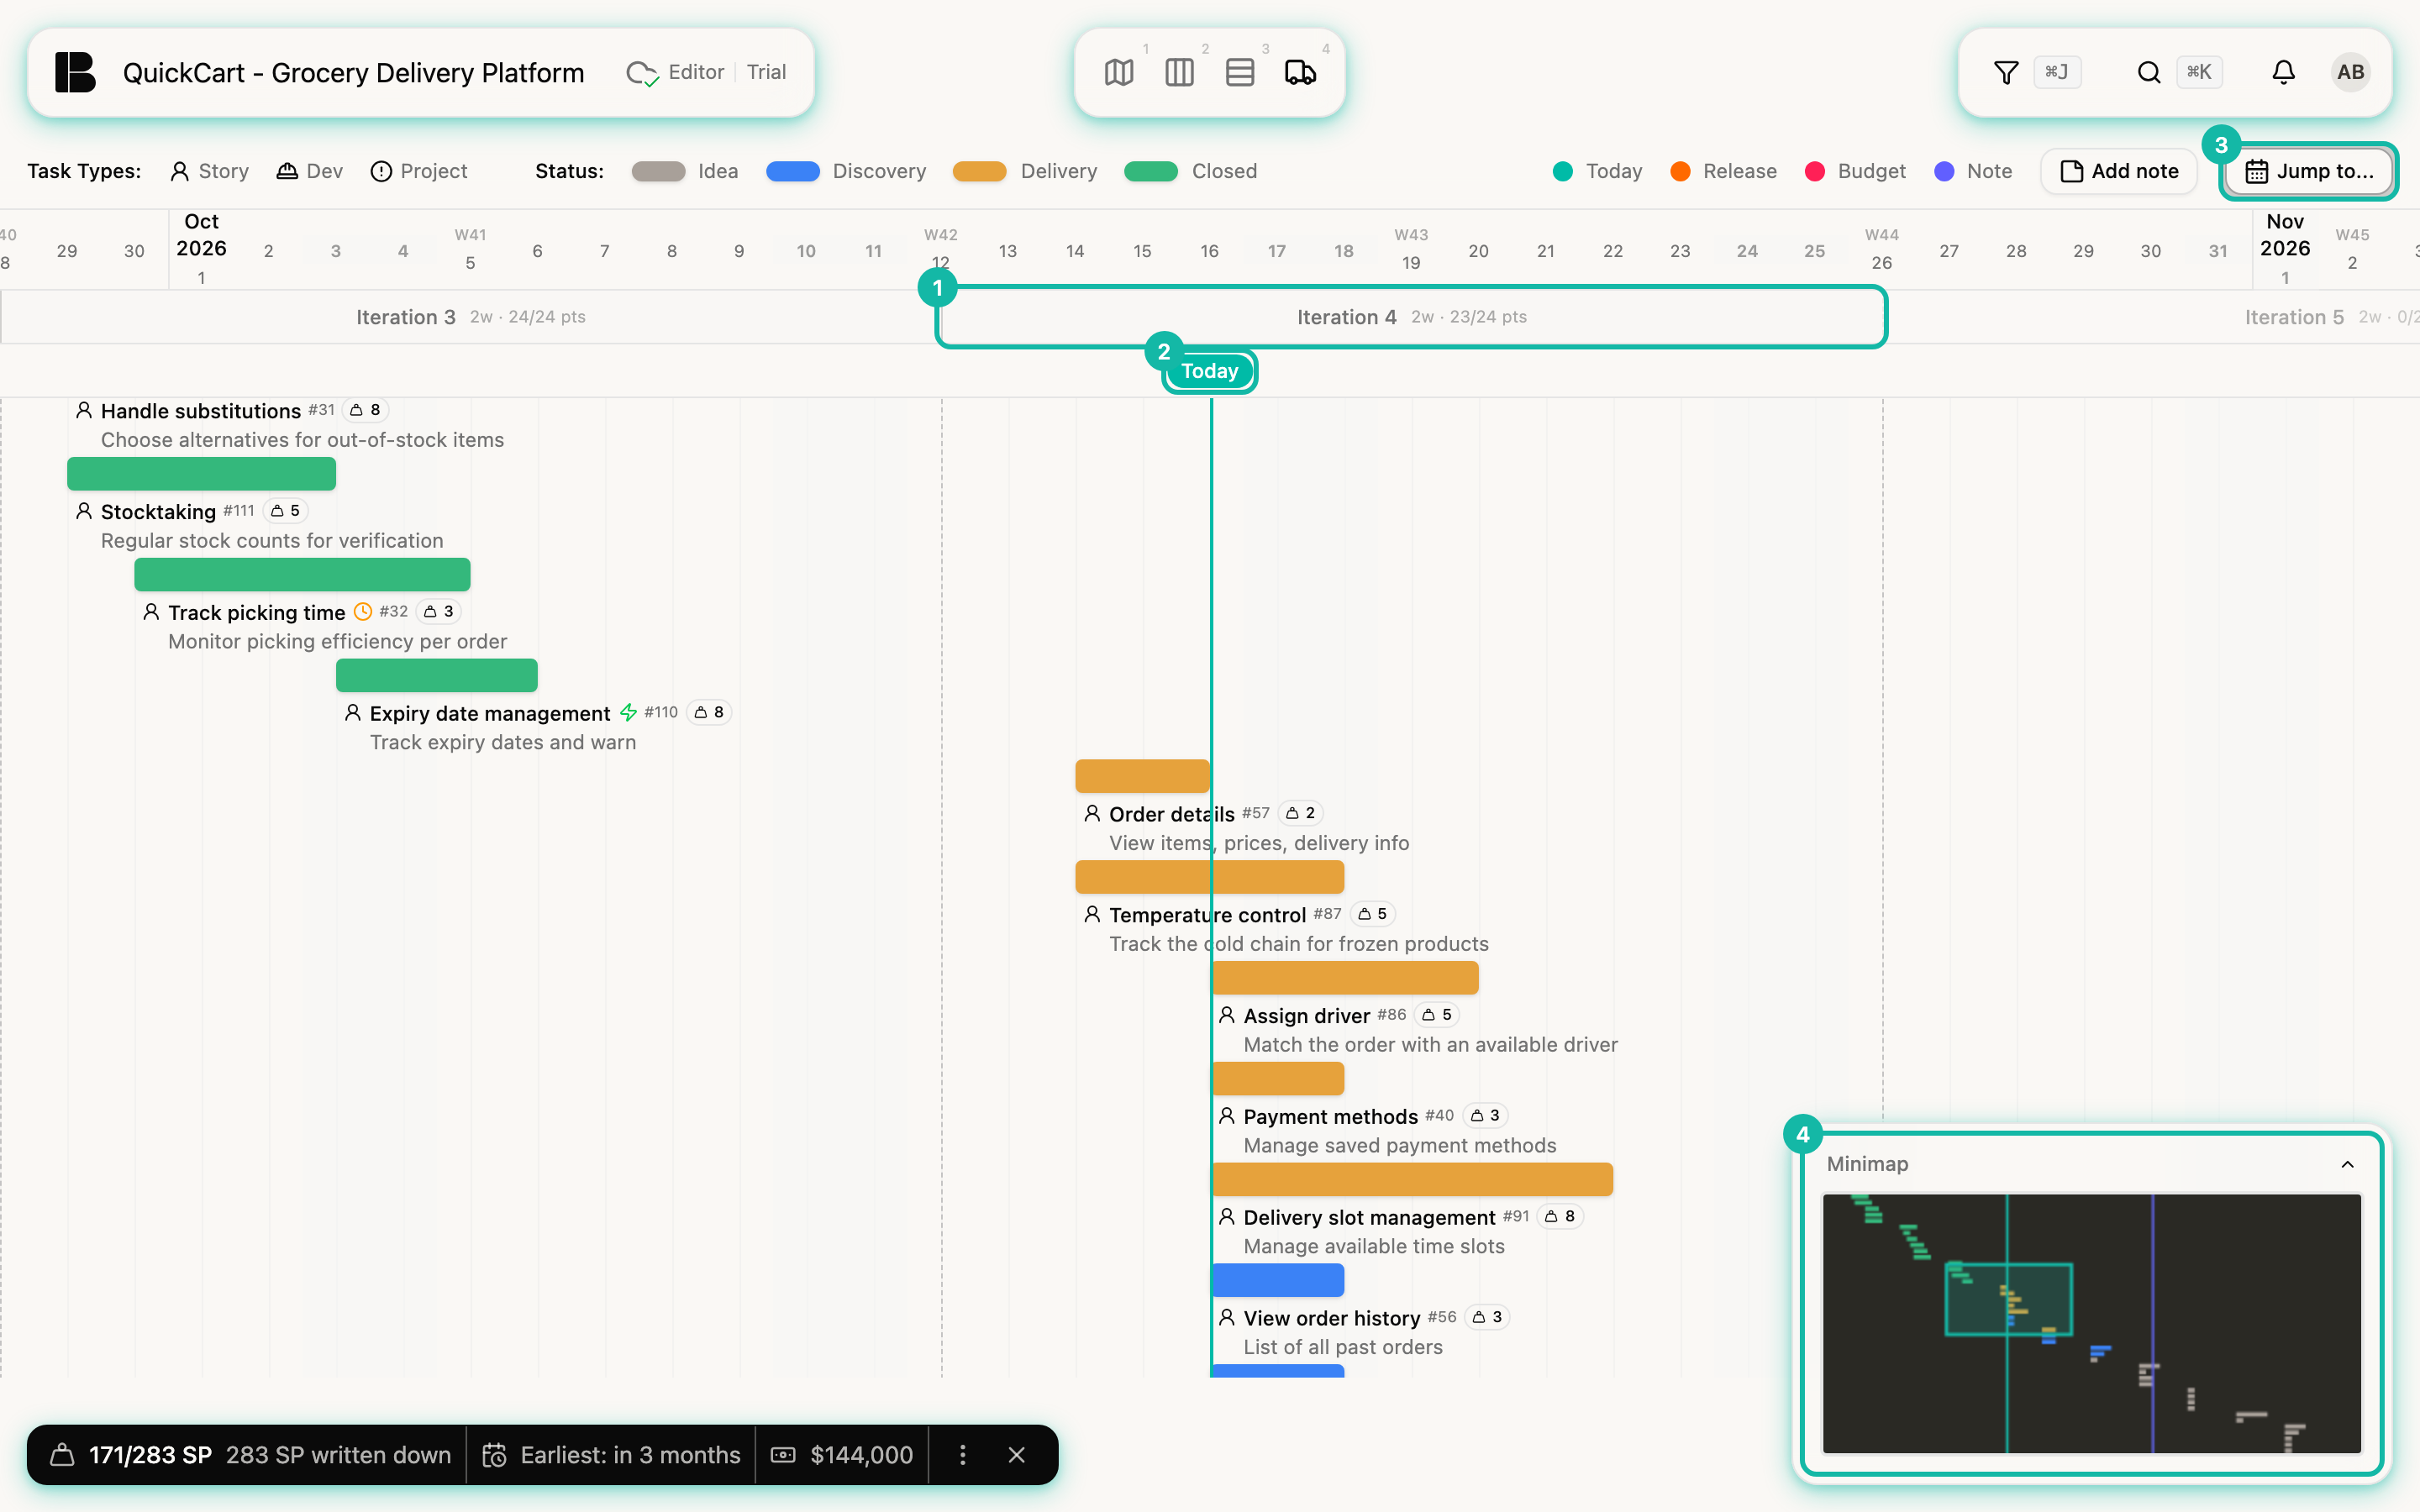
The Delivery Timeline lays your project onto a calendar: What happened when, what is running now, and when is the rest due as things stand? Unlike Progress, which works with points, it shows each story as a bar on the time axis. You find it in the Insights phase (shortcut 4 1).
Layout
- Time axis: At the top are months, calendar weeks and days. You scroll horizontally; the axis has no fixed end.
- Iterations: Below the axis each iteration carries its name, length and completed points, for example Iteration 4 with 2w · 23/24 pts. Dashed vertical lines separate the iterations. Where no iteration exists yet, Betterplan adds pale, imaginary iterations for the forecast.
- Markers: The row below holds Today (teal), Releases (orange), the Budget end (red, only with cost estimation switched on) and Notes (blue-violet). A vertical line runs through the timeline from each marker.
- Story bars: Each story is a bar, coloured by its status: Idea (grey), Discovery (blue), Delivery (orange) and Closed (green), as in the Storyboard and the backlog. The legend at the top also shows the icons of the task types Story, Dev and Project. Below a bar you see title, number, points and short description.
Hover over a bar and a tooltip shows title, points, start and end. For a finished or started story it says (actual), for a planned one (estimated). If a story is overdue or finished earlier than estimated, the tooltip says that too.
Past and forecast
Finished stories run from their real start to their completion. For all others, Betterplan calculates an expected end: the story's estimate, the velocity and the iteration length give its duration. The bars are ordered as follows: started stories first, by their actual start, then stories of the active iteration, then all others by global priority (further along first, within a state the order in the Backlog, not the one in the Storyboard). As many run in parallel as the team handled concurrently on average in past iterations. Stories without an estimate of their own count with the median of all estimates, see Automatic estimates (on the bar: ≈ 3 points - using median estimation). The timeline therefore reaches as far into the future as the backlog contains stories. The background is in How Betterplan forecasts.
The bars in the future are a calculation from velocity and estimates. If velocity, estimates or order change, they move.
The Delivery Timeline always shows the whole project; an active filter hides no bars. To evaluate a section, use Progress, Flow or the Estimation Widget, see Build your own views.
Navigating
- Jump to... opens a menu: Today, Project start, Project end, the Budget (when cost estimation is active) and every release that has a date. A click scrolls the timeline there.
- The minimap at the bottom right is a scaled-down overview with all bars. The outlined rectangle shows the section you are currently viewing. Click or drag in the minimap and the timeline jumps to that spot. There, the vertical teal line marks today and the violet one the timeline note. You expand and collapse it via its header.
- A click on a bar selects the story, Enter or a double-click opens it, Esc clears the selection.
- Hold the
dkey and the timeline shows the dependency cables between stories, as in the Storyboard (see Dependencies).
Timeline notes
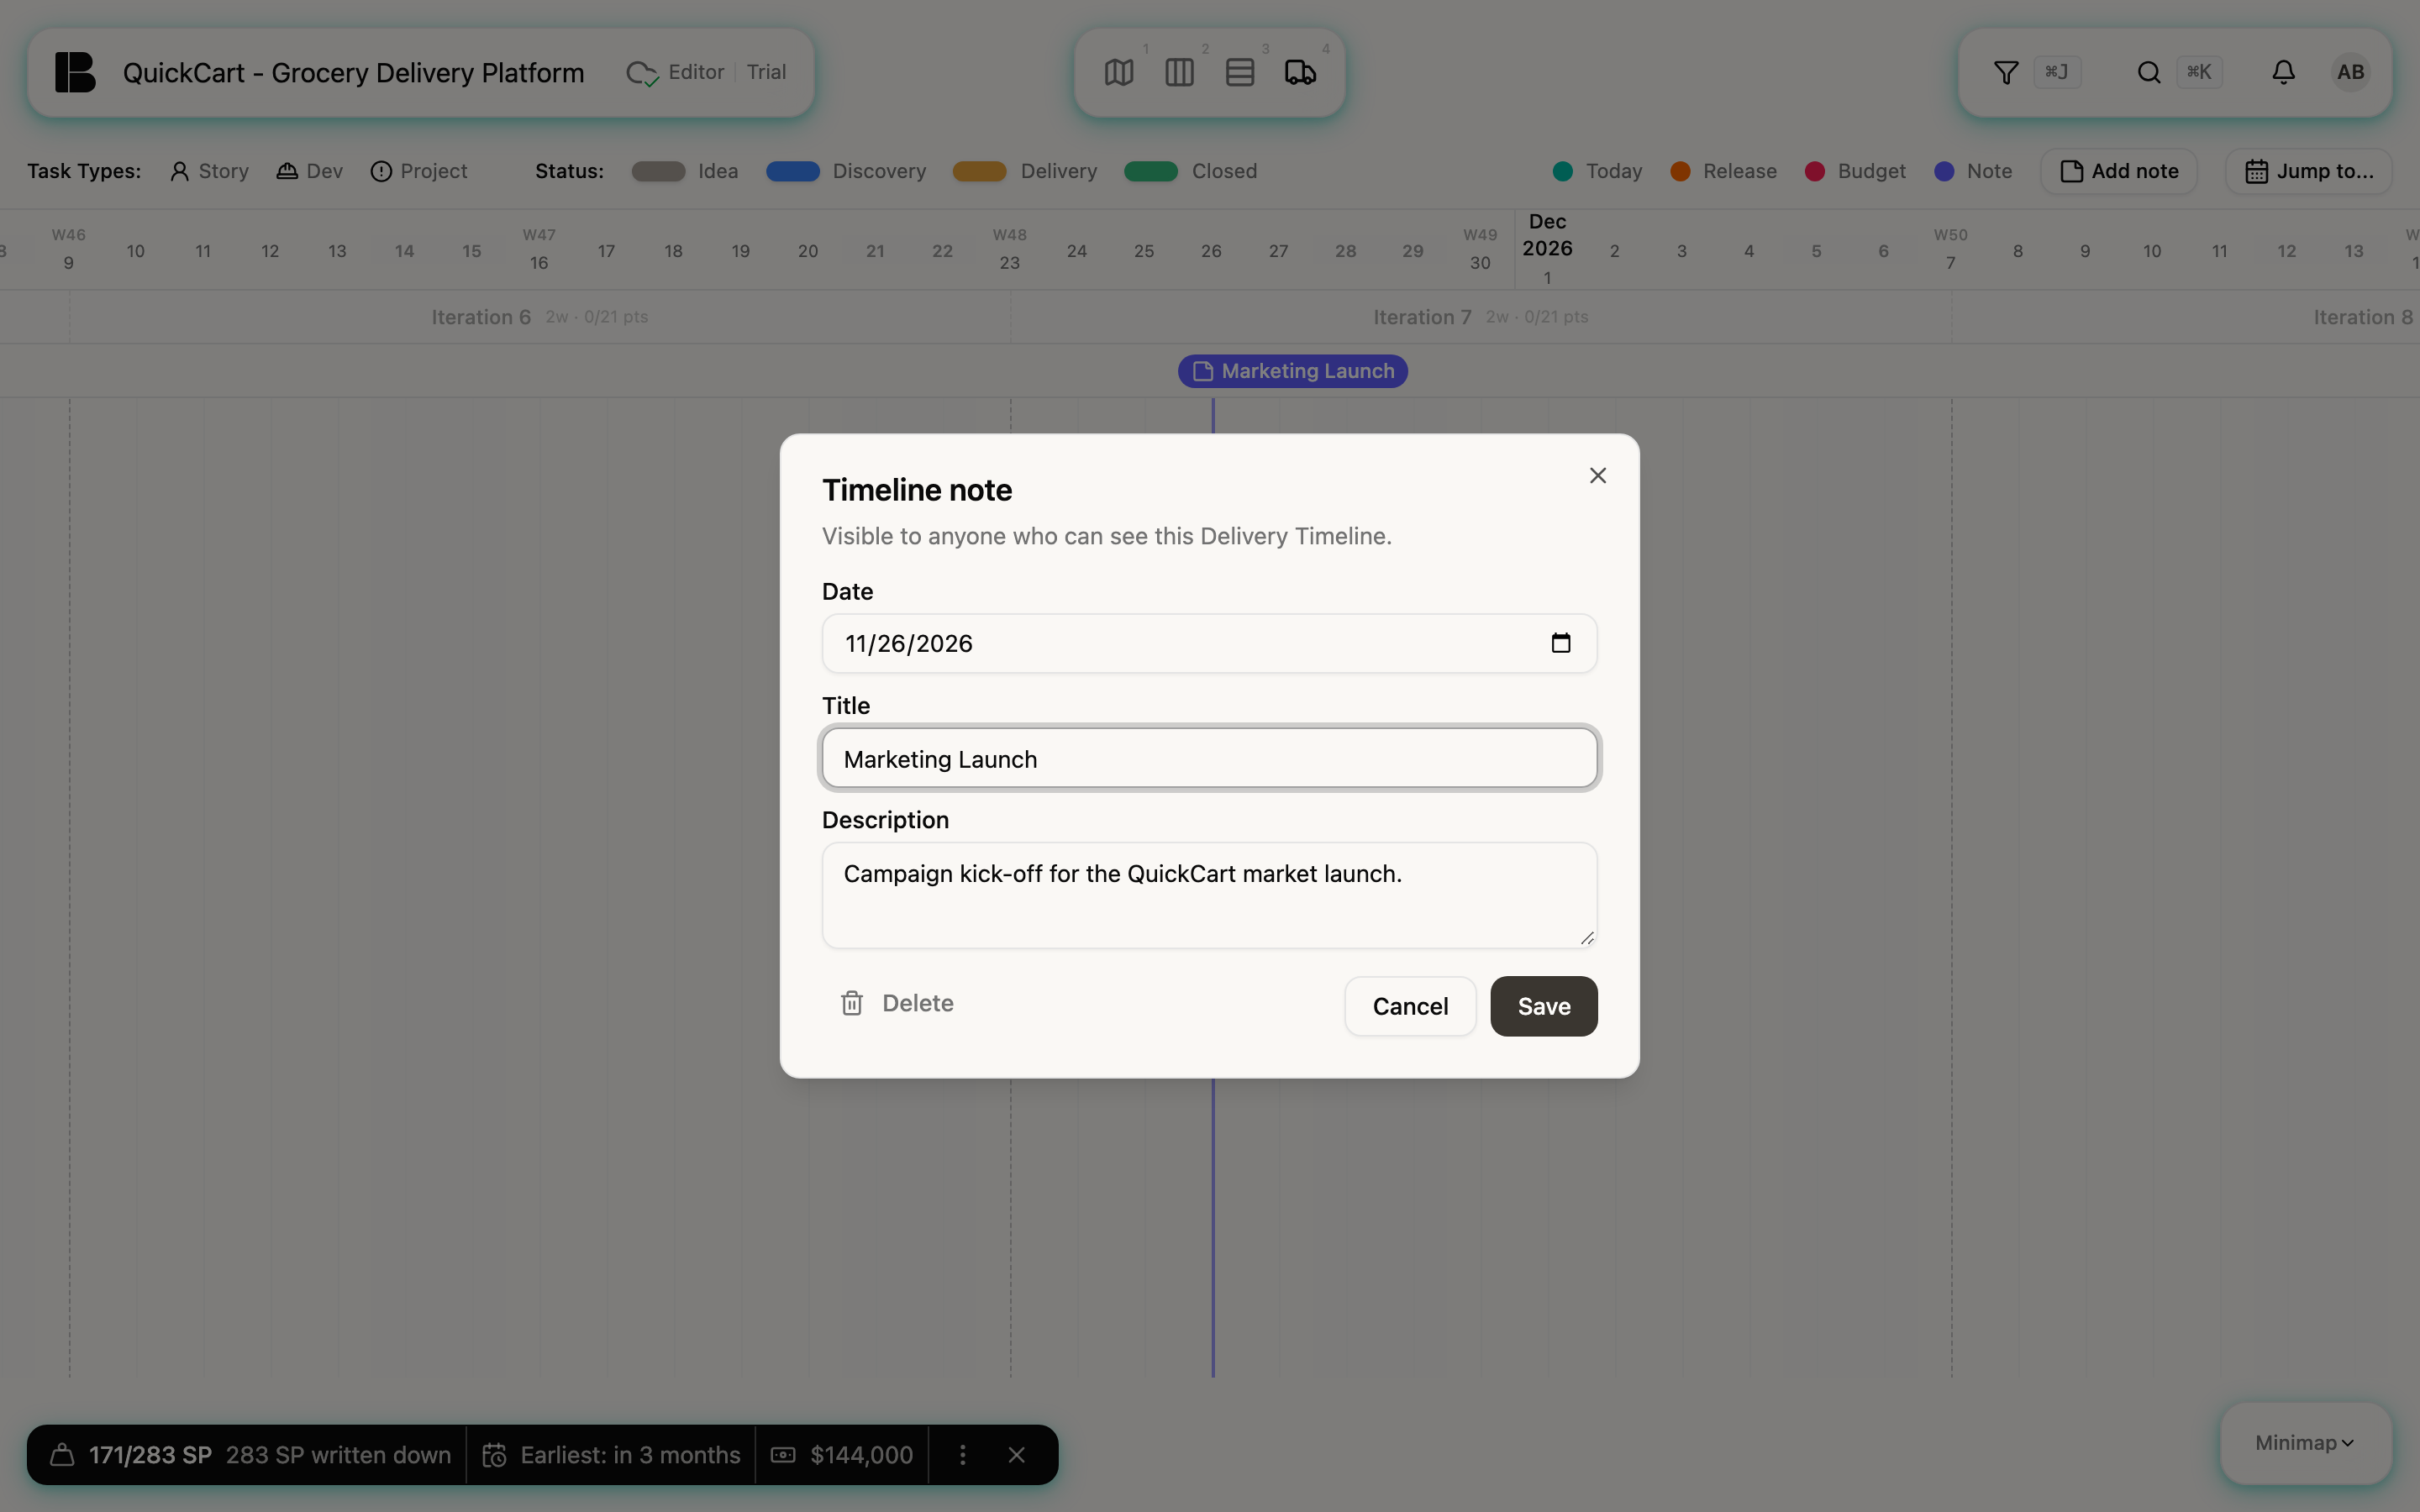
A note records what happened or will happen on the calendar, for instance why an iteration went differently than planned or when a marketing campaign starts. It helps later in conversations with stakeholders and in reviews. A note deliberately has only a date, a title and a description. It is attached to no story, release or iteration.
The QuickCart example project has one note, Marketing Launch, on November 26, 2026.
Creating and editing a note
- Click Add note at the top right. The New timeline note dialog opens, with today as the Date.
- Change the Date if needed and enter a Title (placeholder: What happened?). The Description is for context (Context for stakeholder conversations and reviews).
- Click Save. The timeline jumps to the new note.
To edit, click the note in the marker row, change the fields and save. Delete asks for confirmation (Delete this note?) and cannot be undone.
If several notes are close together, Betterplan merges them into one marker, 2 notes. A click on it opens a picker from which you open the individual note.
The dialog says it: Visible to anyone who can see this Delivery Timeline. That includes guests who view the project through a share link. Only people who may write in the project can create, edit and delete. Read-only viewers see neither Add note nor Save and Delete.
Prerequisites in the settings
The forecast uses velocity, iteration length and, for the budget marker, budget and cost per iteration, all in the project settings on the Team tab (see Estimating). If they are missing, the forecast stays imprecise or the budget marker is absent.