Project settings: Team
The Team tab holds the figures Betterplan uses to predict dates and costs: how much your team gets done, how long an iteration lasts and what it costs. Without these values, forecasts stay empty.
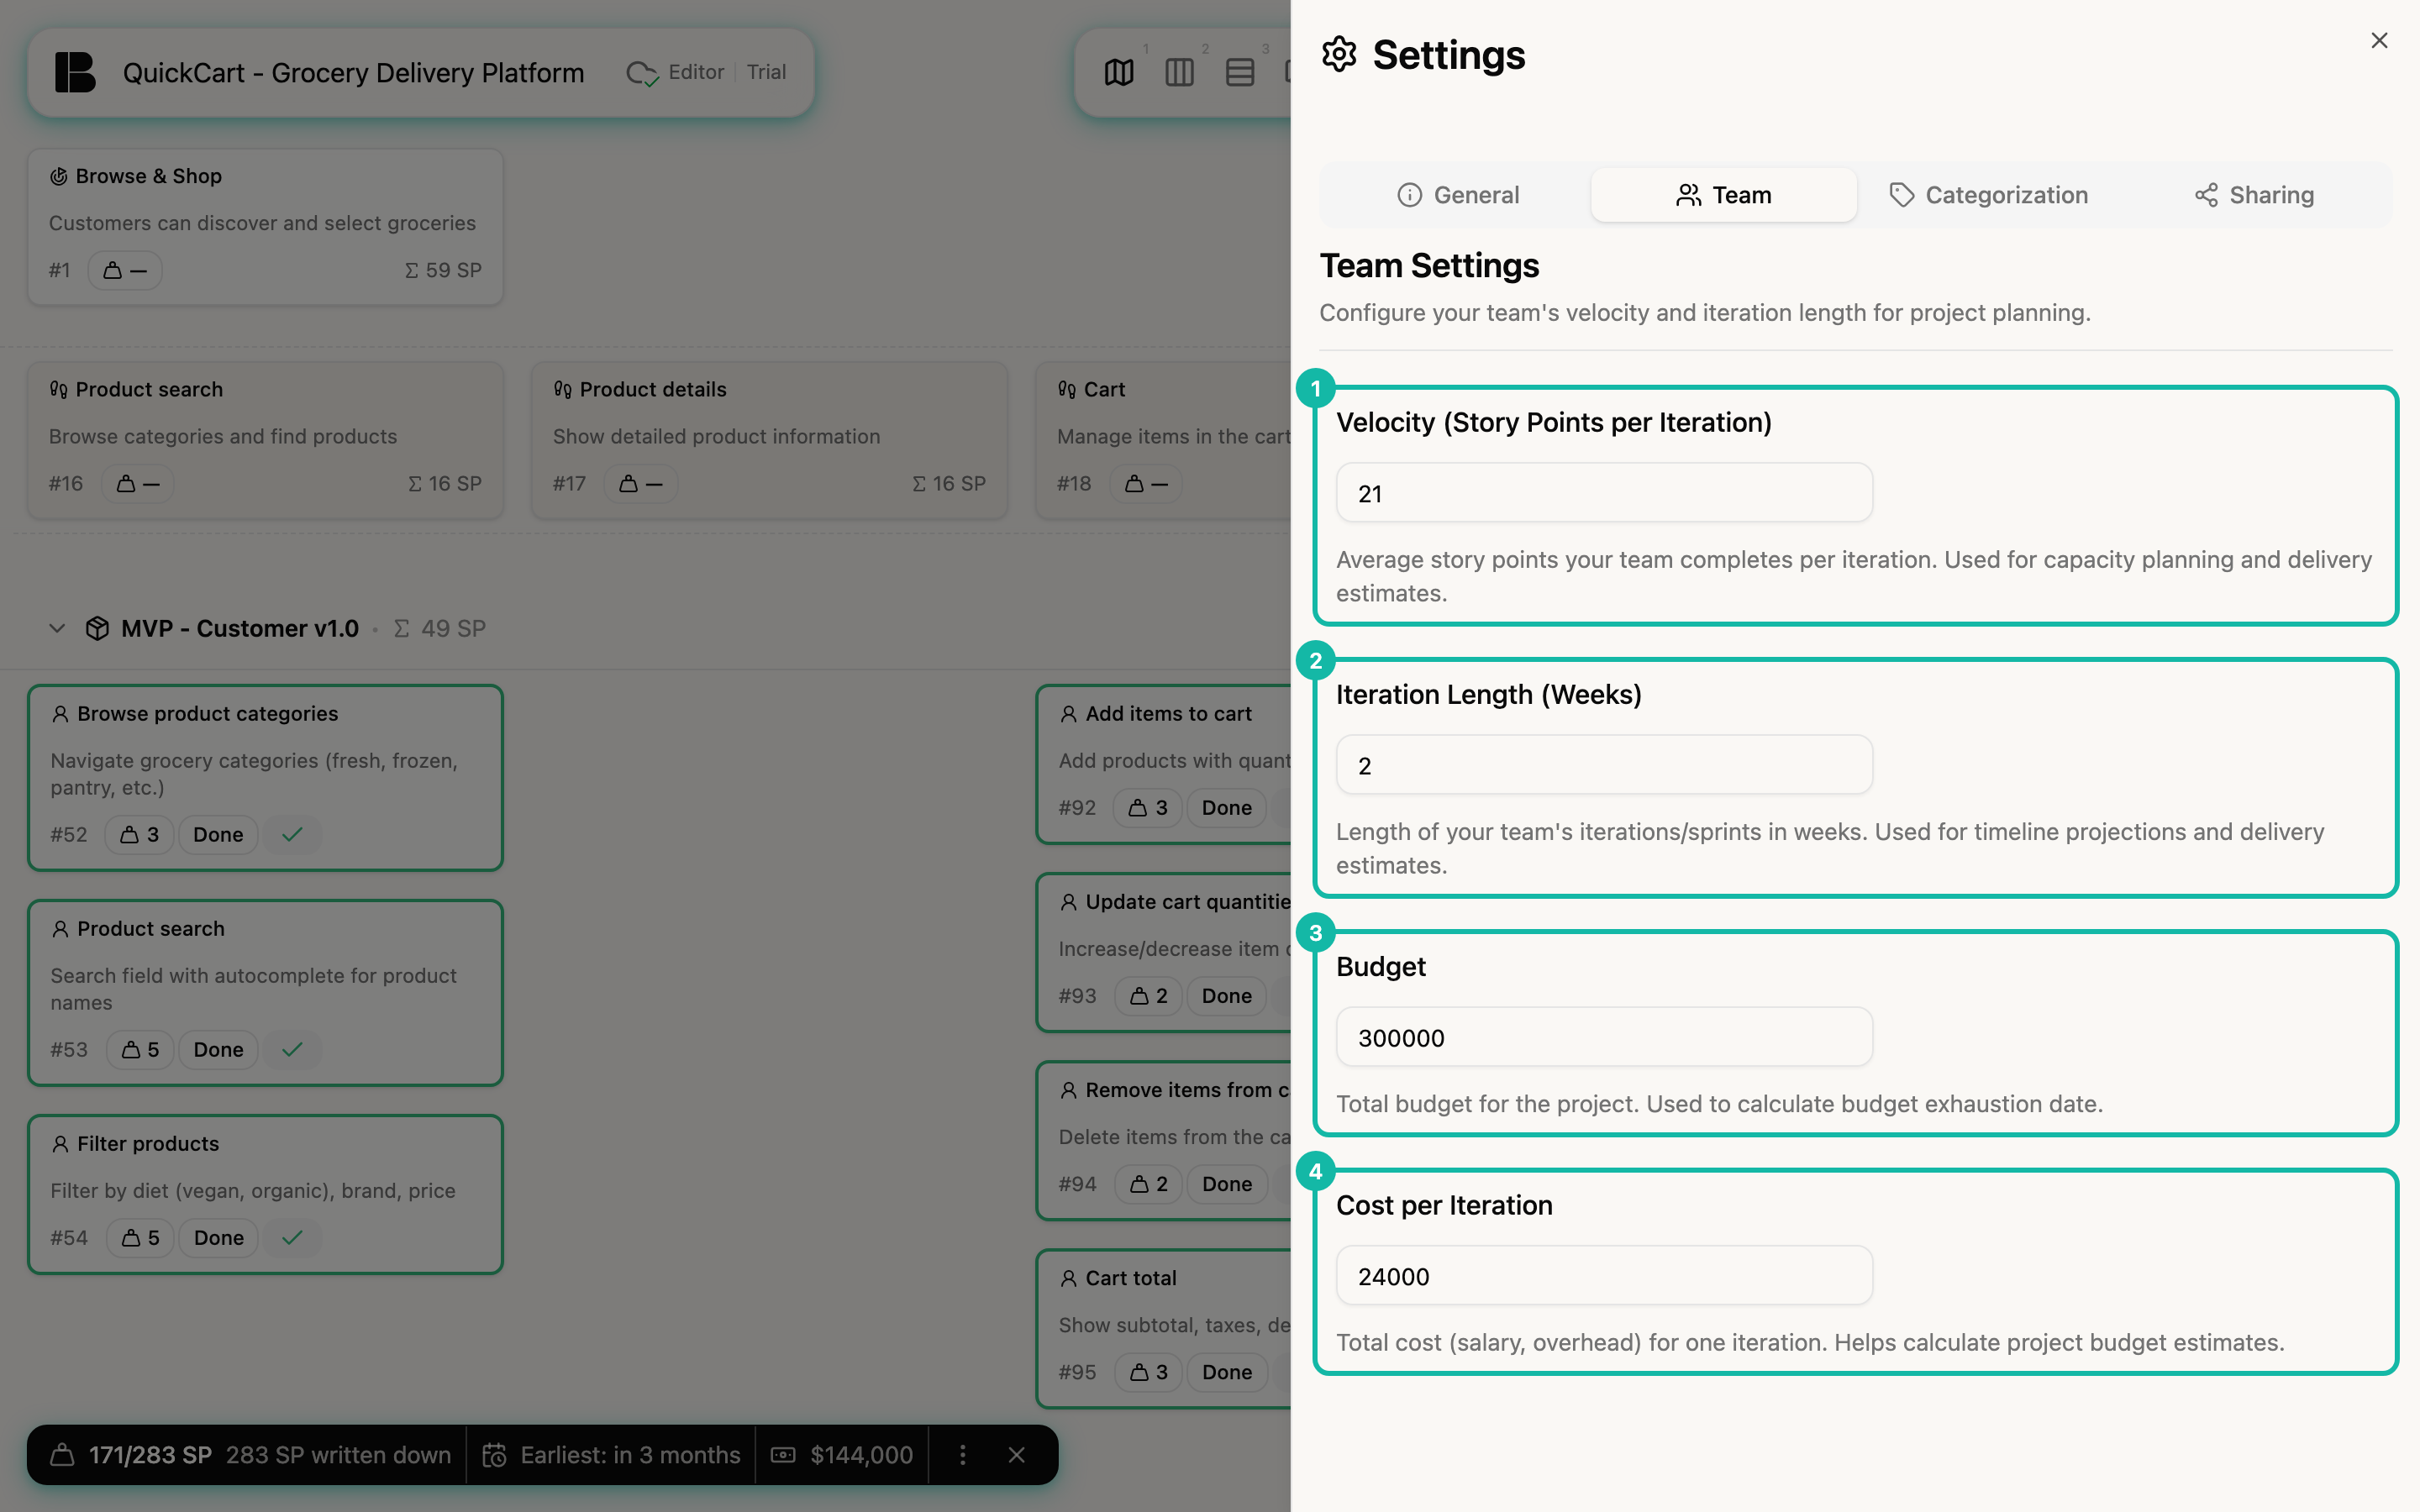
The fields
- Velocity (Story Points per Iteration): The average story points your team completes per iteration. Capacity planning and delivery estimates use it. QuickCart has 21 here.
- Iteration Length (Weeks): How long an iteration lasts, from 1 to 8 weeks. The default is 2. New iterations use it for their end date, and the Timeline uses it for its forecast.
- Budget: The total budget of the project. Betterplan calculates from it when the budget runs out.
- Cost per Iteration: The total cost of one iteration, such as salaries and overhead. Cost estimates are built from it.
The fields save as soon as you leave them.
Early access
Budget and Cost per Iteration belong to cost estimation, which is being rolled out gradually. If you don't see the two fields yet, cost estimation hasn't been enabled for your workspace.
How the values take effect
- Velocity is a starting value. Once you complete iterations, Betterplan uses the average of the last three completed iterations. Your entry only applies until that data exists. A new iteration first shows the actual velocity of the last completed iteration as its Expected velocity, otherwise the value from the settings. The dialog for completing an iteration still mentions a median (Project velocity (median)); the average is what is used.
- Forecasts: The Timeline and the Progress view divide the remaining points by the velocity and lay the iteration length over the result. Without a velocity there is no forecast. The basics are in Forecasting basics.
- Cost: The Estimation Widget turns remaining points, velocity and cost per iteration into an amount. The budget gives the Timeline a marker for the end of the budget.
tip
Enter an honest estimate at the start and don't keep changing it. After three completed iterations, the real numbers take over.